
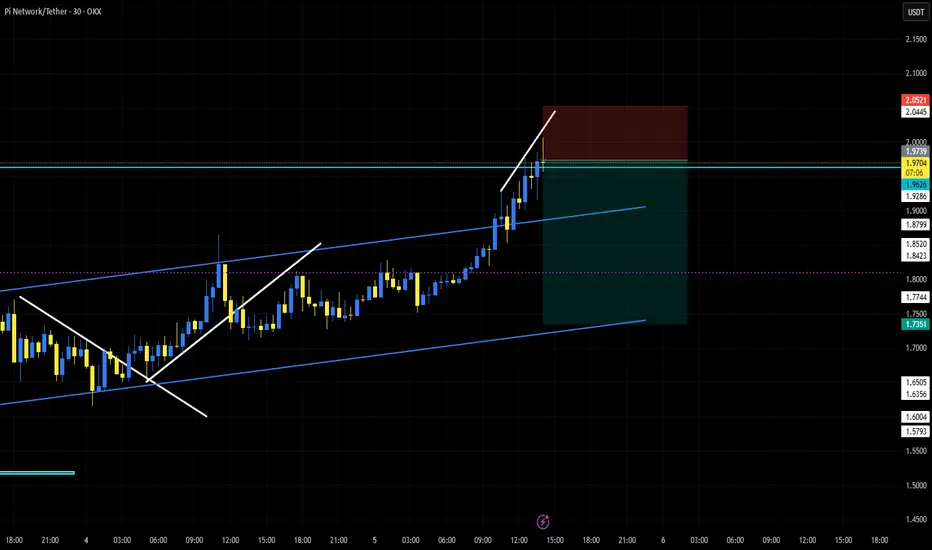
**PI/USDT – 30-Minute Chart Analysis**
The price is moving within an ascending channel and has recently reached the **1.9730 - 2.0445** resistance zone. A rising wedge pattern has formed at the top of this trend, which could indicate weakening bullish momentum.
If the price reacts negatively to this level, a correction towards the **1.8500 - 1.8200** range is possible. Conversely, if the resistance is broken, the price could move towards **2.1000**.
The price is moving within an ascending channel and has recently reached the **1.9730 - 2.0445** resistance zone. A rising wedge pattern has formed at the top of this trend, which could indicate weakening bullish momentum.
If the price reacts negatively to this level, a correction towards the **1.8500 - 1.8200** range is possible. Conversely, if the resistance is broken, the price could move towards **2.1000**.
Giao dịch đang hoạt động
Close at TP1
Thông báo miễn trừ trách nhiệm
Thông tin và các ấn phẩm này không nhằm mục đích, và không cấu thành, lời khuyên hoặc khuyến nghị về tài chính, đầu tư, giao dịch hay các loại khác do TradingView cung cấp hoặc xác nhận. Đọc thêm tại Điều khoản Sử dụng.
Thông báo miễn trừ trách nhiệm
Thông tin và các ấn phẩm này không nhằm mục đích, và không cấu thành, lời khuyên hoặc khuyến nghị về tài chính, đầu tư, giao dịch hay các loại khác do TradingView cung cấp hoặc xác nhận. Đọc thêm tại Điều khoản Sử dụng.