Palantir  PLTR has struggled for some nine months now, falling more than 35% after the cybersecurity stock enjoyed a long, nearly parabolic run that saw it gain some 3,400% between December 2022 and November 2025. Can the stock turn its fortunes back around? Let's see what its chart and fundamentals say.
Palantir's Fundamental Analysis
PLTR will next report quarterly earnings in about four weeks' time, releasing fiscal Q2 results in August.
Although management has yet to set an official date for Palantir's earnings release the Street is looking for the company to show $0.35 in adjusted earnings per share on about $1.81 billion of sales.
If those numbers are what actually hit the tape, that would represent about 119% of year-over-year profit growth on roughly 80% in y/y revenue gains.
Meanwhile, analysts' consensus estimates for the company's full-fiscal-year results call for 97% year-on-year earnings growth and a 73% y/y sales increase. Growth like that doesn't come easily for large-cap stocks.
And impressively, 20 of the 23 sell-side analysts that I know of who cover PLTR have increased their earnings estimates since the quarter began. Zero analysts have reduced their estimates, while three have made no changes.
Bank of America analyst Mariana Perez Mora (rated at five stars out of a possible five by TipRanks) recently reiterated her "Buy" rating on the stock, although she hasn't set a price target on PLTR for a while.
Palantir's Technical Analysis
Now let's go to PLTR's chart going back some seven months and running through Wednesday afternoon (July 8):

Readers will first see that Palantir developed a falling-wedge pattern of bullish reversal that lasted from late 2026 into May.
Marked with tan shading at the chart's left, this set-up didn't really produce much for the stock. Palantir tried to break out of the pattern in late May and rally, but failed to do so.
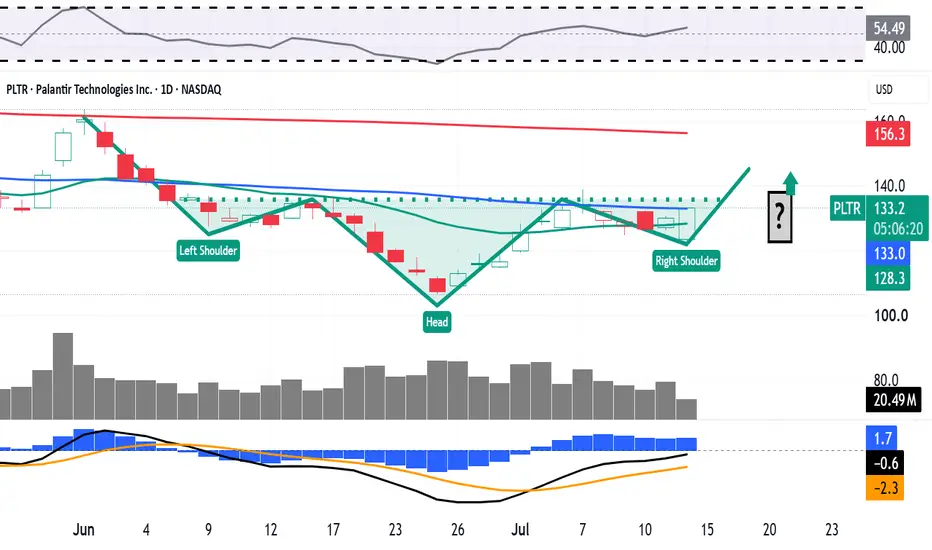
But interestingly, the stock's aborted breakout ended up developing into the first portion of what I think might become an inverse head-and-shoulders pattern (which also predicts bullish reversal).
Marked with green shading at the chart's right, this pattern looks like it's close to two-thirds of the way toward completion.
I've drawn in what could become the pattern's right shoulder if Palantir falters -- which it seems to be doing at its 50-day Simple Moving Average, or "SMA," marked with a blue line at $133.70 above. (The stock closed Monday at $130.04.)
Should Palantir come back, break through and hold the 50-day SMA, then we'll stop looking for an inverse head-and-shoulders pattern.
Instead, portfolio managers would likely have to make decisions on their allocation weightings in the stock in preparation for a potential run at Palantir's 200-day SMA (the red line at $157.10 above).
Until then, the pivot for what might be a bullish pattern in the making would likely stand at $136. (Again, PLTR ended Monday at $130.04.)
Moving on to the other technical indicators above, Palantir's Relative Strength Index (the gray line marked "RSI" at the chart's top) has improved recently, but is struggling to hold above the neutral line.
The stock's daily Moving Average Convergence Divergence indicator (or "MACD," denoted by blue bars, a black line and a gold line at the chart's bottom) has improved as well, but needs more to become strongly bullish.
On one hand, the histogram of the stock's 9-day Exponential Moving Average (or "EMA," marked with blue bars) has moved into positive territory. That's a short-term bullish signal.
Additionally, the 12-day EMA (the black line) is running above the 26-day EMA (the gold line). That's bullish as well. However, that signal's degree of bullishness is somewhat muted by the fact that both of those lines are running below the zero-bound.
(Moomoo Technologies Inc. Markets Commentator Stephen "Sarge" Guilfoyle was long PLTR at the time of writing this column.)
This article discusses technical analysis, other approaches, including fundamental analysis, may offer very different views. The examples provided are for illustrative purposes only and are not intended to be reflective of the results you can expect to achieve. Specific security charts used are for illustrative purposes only and are not a recommendation, offer to sell, or a solicitation of an offer to buy any security. Past investment performance does not indicate or guarantee future success. Returns will vary, and all investments carry risks, including loss of principal. This content is also not a research report and is not intended to serve as the basis for any investment decision. The information contained in this article does not purport to be a complete description of the securities, markets, or developments referred to in this material. Moomoo and its affiliates make no representation or warranty as to the article's adequacy, completeness, accuracy or timeliness for any particular purpose of the above content. Furthermore, there is no guarantee that any statements, estimates, price targets, opinions or forecasts provided herein will prove to be correct.
The Analyst Ratings feature comes from TipRanks, an independent third party. The accuracy, completeness, or reliability cannot be guaranteed and should not be relied upon as a primary basis for any investment decision. The target prices are intended for informational purposes only, not recommendations, and are also not guarantees of future results.
Moomoo is a financial information and trading app offered by Moomoo Technologies Inc. In the U.S., investment products and services on Moomoo are offered by Moomoo Financial Inc., Member FINRA/SIPC.
TradingView is an independent third party not affiliated with Moomoo Financial Inc., Moomoo Technologies Inc., or its affiliates. Moomoo Financial Inc. and its affiliates do not endorse, represent or warrant the completeness and accuracy of the data and information available on the TradingView platform and are not responsible for any services provided by the third-party platform.
PLTR has struggled for some nine months now, falling more than 35% after the cybersecurity stock enjoyed a long, nearly parabolic run that saw it gain some 3,400% between December 2022 and November 2025. Can the stock turn its fortunes back around? Let's see what its chart and fundamentals say.Palantir's Fundamental Analysis
PLTR will next report quarterly earnings in about four weeks' time, releasing fiscal Q2 results in August.
Although management has yet to set an official date for Palantir's earnings release the Street is looking for the company to show $0.35 in adjusted earnings per share on about $1.81 billion of sales.
If those numbers are what actually hit the tape, that would represent about 119% of year-over-year profit growth on roughly 80% in y/y revenue gains.
Meanwhile, analysts' consensus estimates for the company's full-fiscal-year results call for 97% year-on-year earnings growth and a 73% y/y sales increase. Growth like that doesn't come easily for large-cap stocks.
And impressively, 20 of the 23 sell-side analysts that I know of who cover PLTR have increased their earnings estimates since the quarter began. Zero analysts have reduced their estimates, while three have made no changes.
Bank of America analyst Mariana Perez Mora (rated at five stars out of a possible five by TipRanks) recently reiterated her "Buy" rating on the stock, although she hasn't set a price target on PLTR for a while.
Palantir's Technical Analysis
Now let's go to PLTR's chart going back some seven months and running through Wednesday afternoon (July 8):
Readers will first see that Palantir developed a falling-wedge pattern of bullish reversal that lasted from late 2026 into May.
Marked with tan shading at the chart's left, this set-up didn't really produce much for the stock. Palantir tried to break out of the pattern in late May and rally, but failed to do so.
But interestingly, the stock's aborted breakout ended up developing into the first portion of what I think might become an inverse head-and-shoulders pattern (which also predicts bullish reversal).
Marked with green shading at the chart's right, this pattern looks like it's close to two-thirds of the way toward completion.
I've drawn in what could become the pattern's right shoulder if Palantir falters -- which it seems to be doing at its 50-day Simple Moving Average, or "SMA," marked with a blue line at $133.70 above. (The stock closed Monday at $130.04.)
Should Palantir come back, break through and hold the 50-day SMA, then we'll stop looking for an inverse head-and-shoulders pattern.
Instead, portfolio managers would likely have to make decisions on their allocation weightings in the stock in preparation for a potential run at Palantir's 200-day SMA (the red line at $157.10 above).
Until then, the pivot for what might be a bullish pattern in the making would likely stand at $136. (Again, PLTR ended Monday at $130.04.)
Moving on to the other technical indicators above, Palantir's Relative Strength Index (the gray line marked "RSI" at the chart's top) has improved recently, but is struggling to hold above the neutral line.
The stock's daily Moving Average Convergence Divergence indicator (or "MACD," denoted by blue bars, a black line and a gold line at the chart's bottom) has improved as well, but needs more to become strongly bullish.
On one hand, the histogram of the stock's 9-day Exponential Moving Average (or "EMA," marked with blue bars) has moved into positive territory. That's a short-term bullish signal.
Additionally, the 12-day EMA (the black line) is running above the 26-day EMA (the gold line). That's bullish as well. However, that signal's degree of bullishness is somewhat muted by the fact that both of those lines are running below the zero-bound.
(Moomoo Technologies Inc. Markets Commentator Stephen "Sarge" Guilfoyle was long PLTR at the time of writing this column.)
This article discusses technical analysis, other approaches, including fundamental analysis, may offer very different views. The examples provided are for illustrative purposes only and are not intended to be reflective of the results you can expect to achieve. Specific security charts used are for illustrative purposes only and are not a recommendation, offer to sell, or a solicitation of an offer to buy any security. Past investment performance does not indicate or guarantee future success. Returns will vary, and all investments carry risks, including loss of principal. This content is also not a research report and is not intended to serve as the basis for any investment decision. The information contained in this article does not purport to be a complete description of the securities, markets, or developments referred to in this material. Moomoo and its affiliates make no representation or warranty as to the article's adequacy, completeness, accuracy or timeliness for any particular purpose of the above content. Furthermore, there is no guarantee that any statements, estimates, price targets, opinions or forecasts provided herein will prove to be correct.
The Analyst Ratings feature comes from TipRanks, an independent third party. The accuracy, completeness, or reliability cannot be guaranteed and should not be relied upon as a primary basis for any investment decision. The target prices are intended for informational purposes only, not recommendations, and are also not guarantees of future results.
Moomoo is a financial information and trading app offered by Moomoo Technologies Inc. In the U.S., investment products and services on Moomoo are offered by Moomoo Financial Inc., Member FINRA/SIPC.
TradingView is an independent third party not affiliated with Moomoo Financial Inc., Moomoo Technologies Inc., or its affiliates. Moomoo Financial Inc. and its affiliates do not endorse, represent or warrant the completeness and accuracy of the data and information available on the TradingView platform and are not responsible for any services provided by the third-party platform.

Thông báo miễn trừ trách nhiệm
Thông tin và các ấn phẩm này không nhằm mục đích, và không cấu thành, lời khuyên hoặc khuyến nghị về tài chính, đầu tư, giao dịch hay các loại khác do TradingView cung cấp hoặc xác nhận. Đọc thêm tại Điều khoản Sử dụng.
Thông báo miễn trừ trách nhiệm
Thông tin và các ấn phẩm này không nhằm mục đích, và không cấu thành, lời khuyên hoặc khuyến nghị về tài chính, đầu tư, giao dịch hay các loại khác do TradingView cung cấp hoặc xác nhận. Đọc thêm tại Điều khoản Sử dụng.