
PLTR Technical & Options Setup Overview
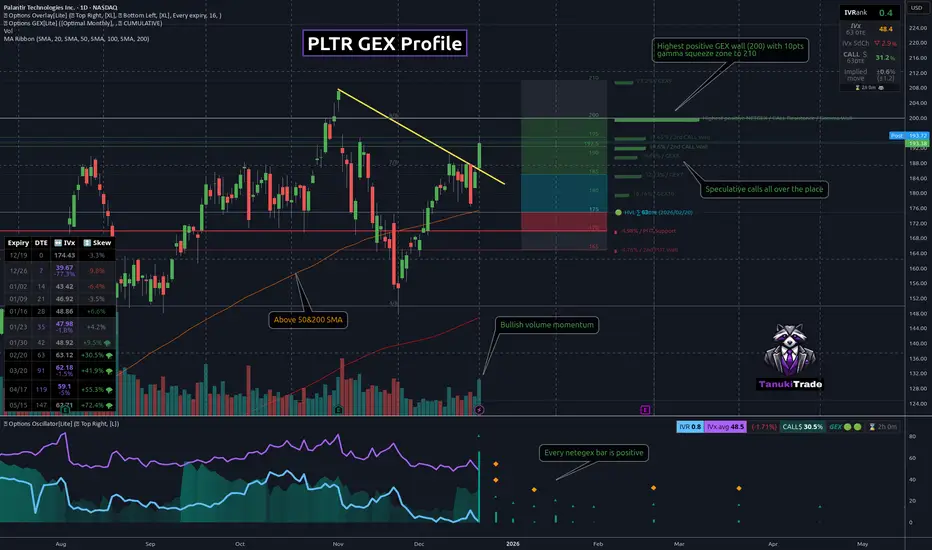
PLTR is setting up a clean bull flag breakout on the daily chart, following a strong impulsive leg higher.
The consolidation has been holding above the 50-day moving average, which has acted as dynamic support throughout the flag structure. Two sessions ago price briefly dipped below the 50 SMA, but that weakness was immediately bought, signaling strong dip demand and structural acceptance above this level.
From an options perspective, the setup remains supportive. On the Feb 20 (Optimal Monthly) expiration, PLTR shows a Positive GEX Profile.
Volatility and skew conditions further strengthen the bullish case:

Looking ahead, the next major reference is the 200 level, which represents the primary Core Resistance for the Optimal Monthly cycle. Given the compression within the bull flag and supportive options structure, 200 becomes a natural upside objective if the breakout confirms.
Structure to watch:
As long as price holds above the 50 DMA and volatility stays contained, risk remains skewed to the upside, with a measured breakout toward 200 favored.
PLTR is setting up a clean bull flag breakout on the daily chart, following a strong impulsive leg higher.
The consolidation has been holding above the 50-day moving average, which has acted as dynamic support throughout the flag structure. Two sessions ago price briefly dipped below the 50 SMA, but that weakness was immediately bought, signaling strong dip demand and structural acceptance above this level.
From an options perspective, the setup remains supportive. On the Feb 20 (Optimal Monthly) expiration, PLTR shows a Positive GEX Profile.
Volatility and skew conditions further strengthen the bullish case:
- Core Call Pricing Skew is elevated (~36%), indicating persistent call demand
- Implied volatility remains relatively low, leaving room for price expansion without volatility headwinds
Looking ahead, the next major reference is the 200 level, which represents the primary Core Resistance for the Optimal Monthly cycle. Given the compression within the bull flag and supportive options structure, 200 becomes a natural upside objective if the breakout confirms.
Structure to watch:
- 50 SMA – key trend support
- Bull flag high – breakout trigger
- Positive GEX – supportive dealer flow
- 200 – next major upside target (Core Resistance)
As long as price holds above the 50 DMA and volatility stays contained, risk remains skewed to the upside, with a measured breakout toward 200 favored.

Boost up your charts with Options PRO!
REAL Options metrics for over 250+ liquid US symbols:
✔ 𝗔𝘂𝘁𝗼-𝗨𝗽𝗱𝗮𝘁𝗶𝗻𝗴 𝗚𝗘𝗫 𝗹𝗲𝘃𝗲𝗹𝘀
✔ GEX ✔ IVRank ✔ CALL/PUT skew ✔ Volatility✔ Delta curves
👉 7-day FREE TRIAL 🌐 TanukiTrade.com
REAL Options metrics for over 250+ liquid US symbols:
✔ 𝗔𝘂𝘁𝗼-𝗨𝗽𝗱𝗮𝘁𝗶𝗻𝗴 𝗚𝗘𝗫 𝗹𝗲𝘃𝗲𝗹𝘀
✔ GEX ✔ IVRank ✔ CALL/PUT skew ✔ Volatility✔ Delta curves
👉 7-day FREE TRIAL 🌐 TanukiTrade.com
Bài đăng liên quan
Thông báo miễn trừ trách nhiệm
Thông tin và các ấn phẩm này không nhằm mục đích, và không cấu thành, lời khuyên hoặc khuyến nghị về tài chính, đầu tư, giao dịch hay các loại khác do TradingView cung cấp hoặc xác nhận. Đọc thêm tại Điều khoản Sử dụng.
Boost up your charts with Options PRO!
REAL Options metrics for over 250+ liquid US symbols:
✔ 𝗔𝘂𝘁𝗼-𝗨𝗽𝗱𝗮𝘁𝗶𝗻𝗴 𝗚𝗘𝗫 𝗹𝗲𝘃𝗲𝗹𝘀
✔ GEX ✔ IVRank ✔ CALL/PUT skew ✔ Volatility✔ Delta curves
👉 7-day FREE TRIAL 🌐 TanukiTrade.com
REAL Options metrics for over 250+ liquid US symbols:
✔ 𝗔𝘂𝘁𝗼-𝗨𝗽𝗱𝗮𝘁𝗶𝗻𝗴 𝗚𝗘𝗫 𝗹𝗲𝘃𝗲𝗹𝘀
✔ GEX ✔ IVRank ✔ CALL/PUT skew ✔ Volatility✔ Delta curves
👉 7-day FREE TRIAL 🌐 TanukiTrade.com
Bài đăng liên quan
Thông báo miễn trừ trách nhiệm
Thông tin và các ấn phẩm này không nhằm mục đích, và không cấu thành, lời khuyên hoặc khuyến nghị về tài chính, đầu tư, giao dịch hay các loại khác do TradingView cung cấp hoặc xác nhận. Đọc thêm tại Điều khoản Sử dụng.