
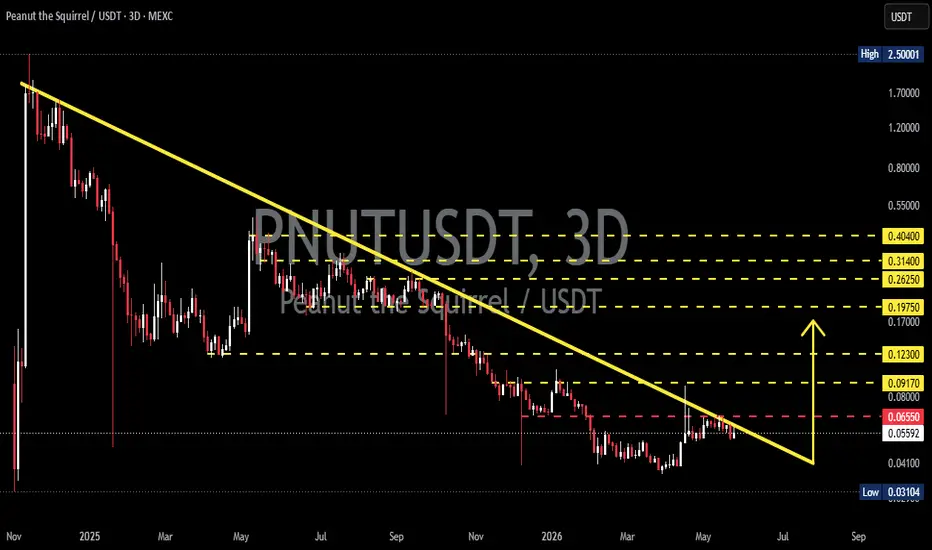
The PNUT/USDT chart on the 3D timeframe is still moving within a major downtrend structure, clearly visible from the Descending TrendLine that has continuously pressured the price since the previous high area. 📊
However, price action is starting to show signs of consolidation at the lower zone and is attempting to approach the main trendline resistance. ⚡
If selling pressure begins to weaken and buying volume increases, this area could potentially become an accumulation phase before a major breakout occurs. 🔥
---
📉 Pattern Analysis — Descending TrendLine
The main pattern on this chart is a Descending TrendLine Resistance, where price continuously forms lower highs while moving downward along the diagonal resistance line. 📐
✨ Characteristics of this pattern:
✅ The main trend is still bearish
✅ Sellers remain dominant while price stays below the trendline
✅ The more often resistance is tested, the weaker it becomes
✅ A valid breakout could trigger a medium-term trend reversal 🚀
Currently, price appears to be compressing near the lower part of the trendline, which is often an early sign before major volatility emerges. ⚠️
---
🟢 Bullish Scenario 🚀
The bullish scenario will activate if PNUT manages to break out and close strongly above the trendline resistance area while reclaiming the nearest horizontal resistance. 📈
🎯 Important bullish levels:
🔹 Initial resistance: 0.06550
🔹 Next resistance: 0.09170
🔹 Next target: 0.12300
🔹 Mid-term target: 0.19750
🔹 Major resistance: 0.26250 — 0.31400
🔹 Extreme bullish target: 0.40400 🚀
If the breakout happens with strong volume, the long-term downtrend structure could potentially shift into a bullish reversal. 🔥
📌 Strong bullish confirmations:
✅ Large breakout candle
✅ Increasing volume
✅ Successful retest of the trendline
✅ Formation of a higher low after breakout
---
🔴 Bearish Scenario 📉
The bearish scenario remains dominant as long as price fails to break out from the Descending TrendLine. ⚠️
❌ Bearish risks to watch:
🔻 Rejection from trendline resistance
🔻 Weakening buy volume
🔻 Breakdown below support areas
🔻 Formation of new lower lows
🛑 Important support areas:
🔸 Minor support: 0.04100
🔸 Major support: 0.03104
If the major support is broken, PNUT could potentially continue its distribution phase and print new lows. 📉
---
📊 Conclusion
PNUT is currently sitting in a critical area as price approaches the end of its long-term Descending TrendLine structure. 📐
The market bias remains bearish, but momentum is beginning to show potential reversal signals if a breakout successfully occurs. 👀🔥
📍 Key areas to monitor:
✔️ Volume reaction
✔️ Trendline breakout
✔️ New support validation
A valid breakout could open the door for a major rally 🚀, while rejection may continue deeper downside pressure 📉
#PNUT #PNUTUSDT #Crypto #TechnicalAnalysis #Altcoin #CryptoTrading #Bullish #Bearish #DescendingTrendline #Breakout #SupportResistance #ChartAnalysis
However, price action is starting to show signs of consolidation at the lower zone and is attempting to approach the main trendline resistance. ⚡
If selling pressure begins to weaken and buying volume increases, this area could potentially become an accumulation phase before a major breakout occurs. 🔥
---
📉 Pattern Analysis — Descending TrendLine
The main pattern on this chart is a Descending TrendLine Resistance, where price continuously forms lower highs while moving downward along the diagonal resistance line. 📐
✨ Characteristics of this pattern:
✅ The main trend is still bearish
✅ Sellers remain dominant while price stays below the trendline
✅ The more often resistance is tested, the weaker it becomes
✅ A valid breakout could trigger a medium-term trend reversal 🚀
Currently, price appears to be compressing near the lower part of the trendline, which is often an early sign before major volatility emerges. ⚠️
---
🟢 Bullish Scenario 🚀
The bullish scenario will activate if PNUT manages to break out and close strongly above the trendline resistance area while reclaiming the nearest horizontal resistance. 📈
🎯 Important bullish levels:
🔹 Initial resistance: 0.06550
🔹 Next resistance: 0.09170
🔹 Next target: 0.12300
🔹 Mid-term target: 0.19750
🔹 Major resistance: 0.26250 — 0.31400
🔹 Extreme bullish target: 0.40400 🚀
If the breakout happens with strong volume, the long-term downtrend structure could potentially shift into a bullish reversal. 🔥
📌 Strong bullish confirmations:
✅ Large breakout candle
✅ Increasing volume
✅ Successful retest of the trendline
✅ Formation of a higher low after breakout
---
🔴 Bearish Scenario 📉
The bearish scenario remains dominant as long as price fails to break out from the Descending TrendLine. ⚠️
❌ Bearish risks to watch:
🔻 Rejection from trendline resistance
🔻 Weakening buy volume
🔻 Breakdown below support areas
🔻 Formation of new lower lows
🛑 Important support areas:
🔸 Minor support: 0.04100
🔸 Major support: 0.03104
If the major support is broken, PNUT could potentially continue its distribution phase and print new lows. 📉
---
📊 Conclusion
PNUT is currently sitting in a critical area as price approaches the end of its long-term Descending TrendLine structure. 📐
The market bias remains bearish, but momentum is beginning to show potential reversal signals if a breakout successfully occurs. 👀🔥
📍 Key areas to monitor:
✔️ Volume reaction
✔️ Trendline breakout
✔️ New support validation
A valid breakout could open the door for a major rally 🚀, while rejection may continue deeper downside pressure 📉
#PNUT #PNUTUSDT #Crypto #TechnicalAnalysis #Altcoin #CryptoTrading #Bullish #Bearish #DescendingTrendline #Breakout #SupportResistance #ChartAnalysis

✅ Get Free Signals! Join Our Telegram Channel Here: t.me/TheCryptoNuclear
✅ Twitter: twitter.com/crypto_nuclear
✅ Join Bybit : partner.bybit.com/b/nuclearvip
✅ Benefits : Lifetime Trading Fee Discount -50%
✅ Twitter: twitter.com/crypto_nuclear
✅ Join Bybit : partner.bybit.com/b/nuclearvip
✅ Benefits : Lifetime Trading Fee Discount -50%
Thông báo miễn trừ trách nhiệm
Thông tin và các ấn phẩm này không nhằm mục đích, và không cấu thành, lời khuyên hoặc khuyến nghị về tài chính, đầu tư, giao dịch hay các loại khác do TradingView cung cấp hoặc xác nhận. Đọc thêm tại Điều khoản Sử dụng.
✅ Get Free Signals! Join Our Telegram Channel Here: t.me/TheCryptoNuclear
✅ Twitter: twitter.com/crypto_nuclear
✅ Join Bybit : partner.bybit.com/b/nuclearvip
✅ Benefits : Lifetime Trading Fee Discount -50%
✅ Twitter: twitter.com/crypto_nuclear
✅ Join Bybit : partner.bybit.com/b/nuclearvip
✅ Benefits : Lifetime Trading Fee Discount -50%
Thông báo miễn trừ trách nhiệm
Thông tin và các ấn phẩm này không nhằm mục đích, và không cấu thành, lời khuyên hoặc khuyến nghị về tài chính, đầu tư, giao dịch hay các loại khác do TradingView cung cấp hoặc xác nhận. Đọc thêm tại Điều khoản Sử dụng.