
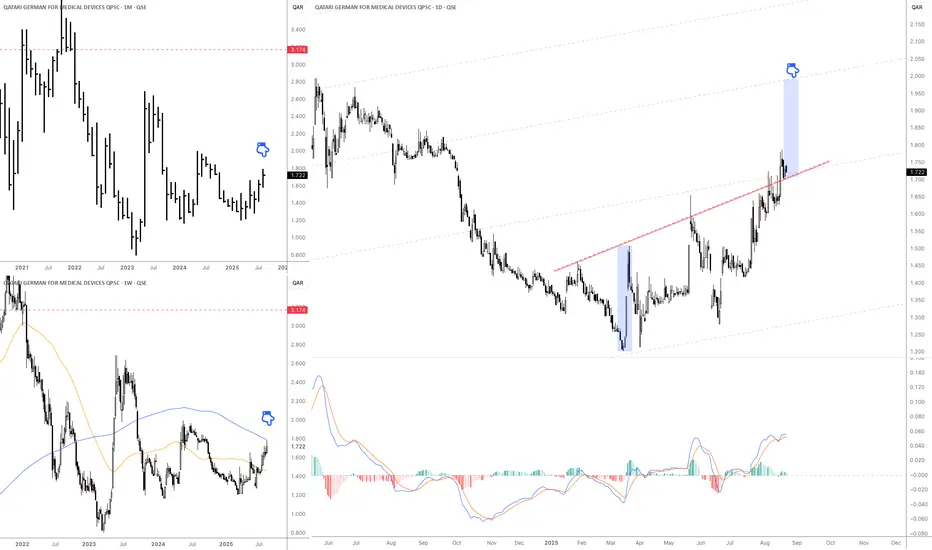
1. Monthly Chart (top-left)
Current price is around QAR 1.72 – 1.80.
Long-term trend has been bearish, but the stock seems to be forming a base and gradually moving higher.
Major long-term resistance sits at QAR 3.17.
2. Weekly Chart (bottom-left)
The 200-week moving average (blue) is close to the current price → a strong resistance test.
A confirmed breakout above the 200-week MA would strengthen the bullish case.
The 50-week moving average (orange) is turning upward, signaling improving momentum.
3. Daily Chart (right side)
The stock broke above a downtrend line (red) and is now holding above it, showing a bullish breakout.
The projected short-term target is around QAR 2.00 – 2.05, based on the rising channel.
MACD indicator is positive, supporting continued bullish momentum.
Key Levels
Nearest Support: QAR 1.60 – 1.65
Short-term Resistance: QAR 2.00 – 2.05
Long-term Resistance: QAR 3.17
Current price is around QAR 1.72 – 1.80.
Long-term trend has been bearish, but the stock seems to be forming a base and gradually moving higher.
Major long-term resistance sits at QAR 3.17.
2. Weekly Chart (bottom-left)
The 200-week moving average (blue) is close to the current price → a strong resistance test.
A confirmed breakout above the 200-week MA would strengthen the bullish case.
The 50-week moving average (orange) is turning upward, signaling improving momentum.
3. Daily Chart (right side)
The stock broke above a downtrend line (red) and is now holding above it, showing a bullish breakout.
The projected short-term target is around QAR 2.00 – 2.05, based on the rising channel.
MACD indicator is positive, supporting continued bullish momentum.
Key Levels
Nearest Support: QAR 1.60 – 1.65
Short-term Resistance: QAR 2.00 – 2.05
Long-term Resistance: QAR 3.17

Thông báo miễn trừ trách nhiệm
Thông tin và các ấn phẩm này không nhằm mục đích, và không cấu thành, lời khuyên hoặc khuyến nghị về tài chính, đầu tư, giao dịch hay các loại khác do TradingView cung cấp hoặc xác nhận. Đọc thêm tại Điều khoản Sử dụng.
Thông báo miễn trừ trách nhiệm
Thông tin và các ấn phẩm này không nhằm mục đích, và không cấu thành, lời khuyên hoặc khuyến nghị về tài chính, đầu tư, giao dịch hay các loại khác do TradingView cung cấp hoặc xác nhận. Đọc thêm tại Điều khoản Sử dụng.