
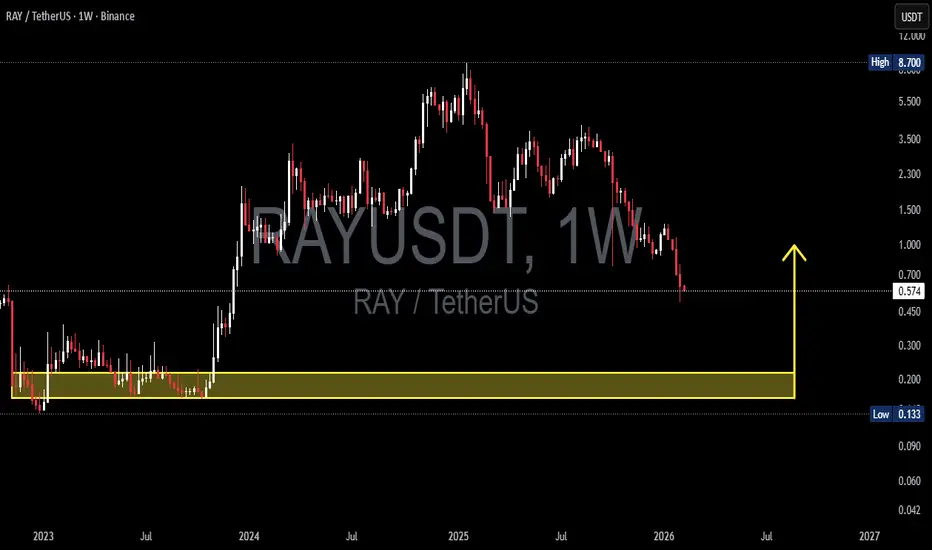
On the Weekly timeframe, RAYUSDT remains in a clear macro downtrend after forming its peak around the 8.7 USDT region. Following a distribution phase in the mid-range area (2 – 3.5), price continued declining gradually, forming consistent lower highs and lower lows.
Currently, price action is approaching a major historical demand / support zone that previously acted as the accumulation base before the massive 2024 rally.
Key zone:
0.215 – 0.160 USDT (Weekly Demand Block)
This area will determine whether the structure forms a macro bottom or continues into a deeper breakdown.
---
Pattern Explanation
1. Macro Distribution → Markdown Phase
After the parabolic rally, price entered distribution.
Wide consolidation range formed.
Support breakdown triggered further markdown.
2. Descending Structure
Characteristics visible on the chart:
Consecutive Lower Highs.
Gradual Lower Lows.
No significant bullish structure break yet.
3. Potential Double Bottom / Accumulation Base
If the demand zone holds, possible formations include:
Double Bottom.
Rounded Base.
Wyckoff Accumulation (Phase A–C).
The yellow zone acts as the last line of defense for buyers.
---
Key Levels
Resistance:
1.00 USDT — Psychological + minor structure.
1.50 USDT — Previous consolidation area.
2.30 – 3.50 USDT — Major supply zone.
5.50+ USDT — Macro distribution region.
Support / Demand:
0.573 USDT — Current reaction level.
0.215 – 0.160 USDT — Major Weekly Demand (Highlighted).
0.133 USDT — Absolute historical low.
---
Bullish Scenario
Bullish confirmation requires:
1. Price sweeps / taps the 0.215 – 0.160 demand zone.
2. Strong rejection appears (long wick / Weekly bullish engulfing).
3. Volume expansion at the lows.
4. Structure break above 1.00 USDT.
Potential upside targets:
Relief rally toward 1.00.
Continuation to 1.50.
Mid-term reversal toward 2.30 – 3.50.
If large accumulation occurs, the macro upside could expand significantly since this zone was the base of the previous rally.
---
Bearish Scenario
Bearish continuation triggers if:
1. Weekly close breaks below 0.160.
2. Demand zone fails to hold.
3. No significant volume reaction appears.
Implications:
Drop toward 0.133 (ATL retest).
If ATL breaks → downside price discovery.
Structure shifts into long-term markdown continuation.
The yellow zone would flip from demand into supply.
---
Conclusion
RAYUSDT is currently at a critical macro level.
Primary trend: Bearish.
Price is approaching major historical demand.
The 0.215 – 0.160 zone will decide reversal vs continuation.
Price reaction here will determine whether the market forms:
A macro bottom, or
A deeper bear market expansion.
Traders should wait for clear price action confirmation before taking large positions.
#RAYUSDT #RAY #Raydium #CryptoAnalysis #TechnicalAnalysis #Altcoins #SupportResistance #Wyckoff #CryptoTrading #Downtrend #Accumulation #MarketStructure #AltcoinSeason #CryptoChart
Currently, price action is approaching a major historical demand / support zone that previously acted as the accumulation base before the massive 2024 rally.
Key zone:
0.215 – 0.160 USDT (Weekly Demand Block)
This area will determine whether the structure forms a macro bottom or continues into a deeper breakdown.
---
Pattern Explanation
1. Macro Distribution → Markdown Phase
After the parabolic rally, price entered distribution.
Wide consolidation range formed.
Support breakdown triggered further markdown.
2. Descending Structure
Characteristics visible on the chart:
Consecutive Lower Highs.
Gradual Lower Lows.
No significant bullish structure break yet.
3. Potential Double Bottom / Accumulation Base
If the demand zone holds, possible formations include:
Double Bottom.
Rounded Base.
Wyckoff Accumulation (Phase A–C).
The yellow zone acts as the last line of defense for buyers.
---
Key Levels
Resistance:
1.00 USDT — Psychological + minor structure.
1.50 USDT — Previous consolidation area.
2.30 – 3.50 USDT — Major supply zone.
5.50+ USDT — Macro distribution region.
Support / Demand:
0.573 USDT — Current reaction level.
0.215 – 0.160 USDT — Major Weekly Demand (Highlighted).
0.133 USDT — Absolute historical low.
---
Bullish Scenario
Bullish confirmation requires:
1. Price sweeps / taps the 0.215 – 0.160 demand zone.
2. Strong rejection appears (long wick / Weekly bullish engulfing).
3. Volume expansion at the lows.
4. Structure break above 1.00 USDT.
Potential upside targets:
Relief rally toward 1.00.
Continuation to 1.50.
Mid-term reversal toward 2.30 – 3.50.
If large accumulation occurs, the macro upside could expand significantly since this zone was the base of the previous rally.
---
Bearish Scenario
Bearish continuation triggers if:
1. Weekly close breaks below 0.160.
2. Demand zone fails to hold.
3. No significant volume reaction appears.
Implications:
Drop toward 0.133 (ATL retest).
If ATL breaks → downside price discovery.
Structure shifts into long-term markdown continuation.
The yellow zone would flip from demand into supply.
---
Conclusion
RAYUSDT is currently at a critical macro level.
Primary trend: Bearish.
Price is approaching major historical demand.
The 0.215 – 0.160 zone will decide reversal vs continuation.
Price reaction here will determine whether the market forms:
A macro bottom, or
A deeper bear market expansion.
Traders should wait for clear price action confirmation before taking large positions.
#RAYUSDT #RAY #Raydium #CryptoAnalysis #TechnicalAnalysis #Altcoins #SupportResistance #Wyckoff #CryptoTrading #Downtrend #Accumulation #MarketStructure #AltcoinSeason #CryptoChart

✅ Get Free Signals! Join Our Telegram Channel Here: t.me/TheCryptoNuclear
✅ Twitter: twitter.com/crypto_nuclear
✅ Join Bybit : partner.bybit.com/b/nuclearvip
✅ Benefits : Lifetime Trading Fee Discount -50%
✅ Twitter: twitter.com/crypto_nuclear
✅ Join Bybit : partner.bybit.com/b/nuclearvip
✅ Benefits : Lifetime Trading Fee Discount -50%
Thông báo miễn trừ trách nhiệm
Thông tin và các ấn phẩm này không nhằm mục đích, và không cấu thành, lời khuyên hoặc khuyến nghị về tài chính, đầu tư, giao dịch hay các loại khác do TradingView cung cấp hoặc xác nhận. Đọc thêm tại Điều khoản Sử dụng.
✅ Get Free Signals! Join Our Telegram Channel Here: t.me/TheCryptoNuclear
✅ Twitter: twitter.com/crypto_nuclear
✅ Join Bybit : partner.bybit.com/b/nuclearvip
✅ Benefits : Lifetime Trading Fee Discount -50%
✅ Twitter: twitter.com/crypto_nuclear
✅ Join Bybit : partner.bybit.com/b/nuclearvip
✅ Benefits : Lifetime Trading Fee Discount -50%
Thông báo miễn trừ trách nhiệm
Thông tin và các ấn phẩm này không nhằm mục đích, và không cấu thành, lời khuyên hoặc khuyến nghị về tài chính, đầu tư, giao dịch hay các loại khác do TradingView cung cấp hoặc xác nhận. Đọc thêm tại Điều khoản Sử dụng.