
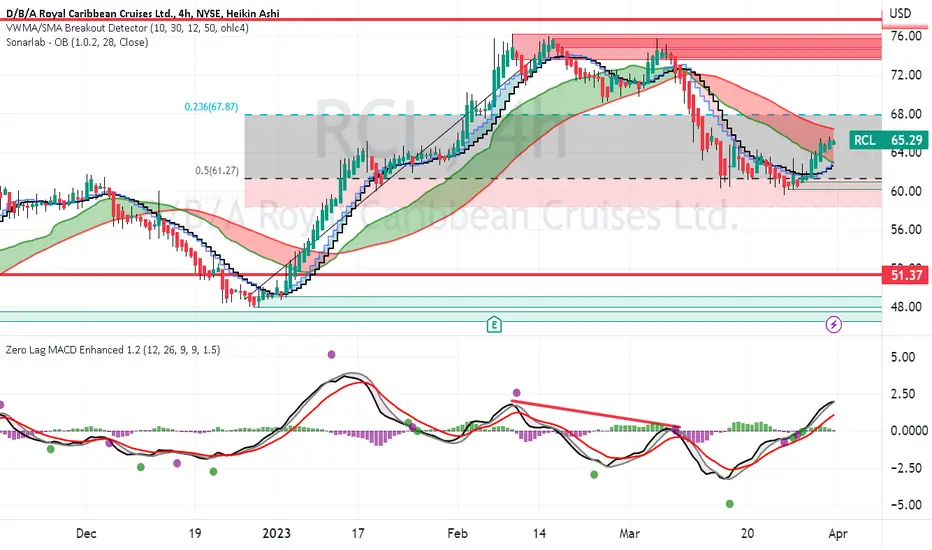
RCL had a triple top this past winder then downtrend to the Fib 0.5 level.
On the chart, the tripe top is also resistance with sell orders blocks by the indicator.
The fib 0.5 level $ 61.27 is the support. A stop loss could be placed immediately
below that. The zero-lag MACD shows nearish divergence while the price rose into
the triple. That divergence has not yet recurred. I see this as a swing long while
RCL seeks to recover its customer base and rebuild its revenue stream.
On the chart, the tripe top is also resistance with sell orders blocks by the indicator.
The fib 0.5 level $ 61.27 is the support. A stop loss could be placed immediately
below that. The zero-lag MACD shows nearish divergence while the price rose into
the triple. That divergence has not yet recurred. I see this as a swing long while
RCL seeks to recover its customer base and rebuild its revenue stream.

Thông báo miễn trừ trách nhiệm
Thông tin và các ấn phẩm này không nhằm mục đích, và không cấu thành, lời khuyên hoặc khuyến nghị về tài chính, đầu tư, giao dịch hay các loại khác do TradingView cung cấp hoặc xác nhận. Đọc thêm tại Điều khoản Sử dụng.
Thông báo miễn trừ trách nhiệm
Thông tin và các ấn phẩm này không nhằm mục đích, và không cấu thành, lời khuyên hoặc khuyến nghị về tài chính, đầu tư, giao dịch hay các loại khác do TradingView cung cấp hoặc xác nhận. Đọc thêm tại Điều khoản Sử dụng.