Date: 30-Nov-2025
LTP: Rs. 1,567.50
Technical View:
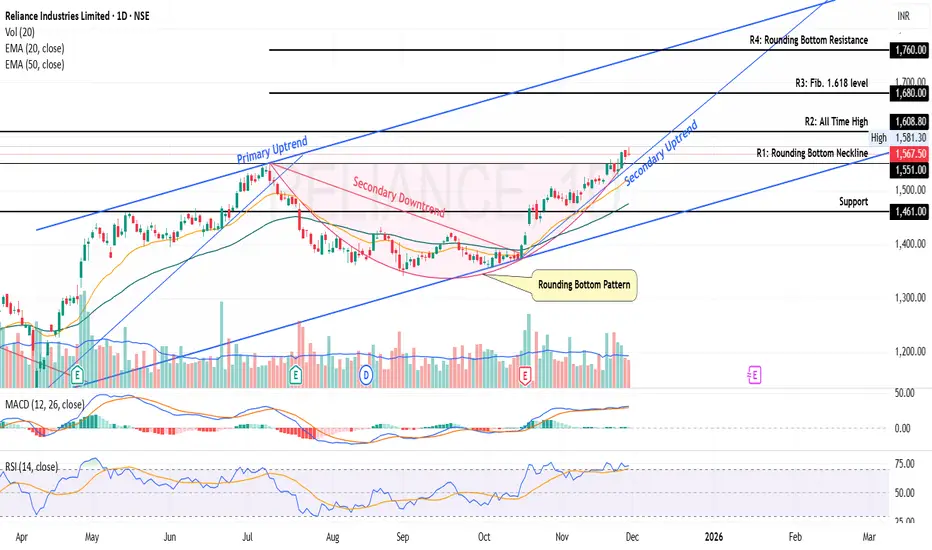
• RELIANCE is in primary uptrend since Apr 2025 and currently trading through it's secondary uptrend since 16-Oct-2025.
• After touching the high of 1,551 on 9-Jul-2025, it has retraced 14% to 1,340.60 level.
•RELIANCE has formed a Rounding Bottom Pattern and has breakout from it's neckline with higher than average volume on 26-Nov-2025. The Rounding Bottom Neckline is marked as 1st Resistance (R1) in chart and is placed at 1,551.
•RELIANCE is trading above 20 DEMA and 50 DEMA since last few weeks.
• MACD is trading at 30.91 and RSI is trading at 72.71.
•RELIANCE is looking bullish from here onwards.
• Resistance Levels: (R2) Rs. 1,608 --> (R3) Rs. 1,680 --> (R4) Rs. 1760
• Support Level: Rs. 1,461
If you have liked this analysis, please Like/Boost this idea and follow me for more ideas.
Disclaimer: I am not a SEBI registered analyst/consultant and not recommending anyone to take any BUY or SELL position in stock market. Investing in stock market is risky and one should do a self analysis and validation before investing in stock market. My ideas are published for learning purpose only and are available to everyone at no cost/charge.
LTP: Rs. 1,567.50
Technical View:
•
RELIANCE is in primary uptrend since Apr 2025 and currently trading through it's secondary uptrend since 16-Oct-2025.• After touching the high of 1,551 on 9-Jul-2025, it has retraced 14% to 1,340.60 level.
•
RELIANCE has formed a Rounding Bottom Pattern and has breakout from it's neckline with higher than average volume on 26-Nov-2025. The Rounding Bottom Neckline is marked as 1st Resistance (R1) in chart and is placed at 1,551.•
RELIANCE is trading above 20 DEMA and 50 DEMA since last few weeks.• MACD is trading at 30.91 and RSI is trading at 72.71.
•
RELIANCE is looking bullish from here onwards.• Resistance Levels: (R2) Rs. 1,608 --> (R3) Rs. 1,680 --> (R4) Rs. 1760
• Support Level: Rs. 1,461
If you have liked this analysis, please Like/Boost this idea and follow me for more ideas.
Disclaimer: I am not a SEBI registered analyst/consultant and not recommending anyone to take any BUY or SELL position in stock market. Investing in stock market is risky and one should do a self analysis and validation before investing in stock market. My ideas are published for learning purpose only and are available to everyone at no cost/charge.

Thông báo miễn trừ trách nhiệm
Thông tin và các ấn phẩm này không nhằm mục đích, và không cấu thành, lời khuyên hoặc khuyến nghị về tài chính, đầu tư, giao dịch hay các loại khác do TradingView cung cấp hoặc xác nhận. Đọc thêm tại Điều khoản Sử dụng.
Thông báo miễn trừ trách nhiệm
Thông tin và các ấn phẩm này không nhằm mục đích, và không cấu thành, lời khuyên hoặc khuyến nghị về tài chính, đầu tư, giao dịch hay các loại khác do TradingView cung cấp hoặc xác nhận. Đọc thêm tại Điều khoản Sử dụng.