
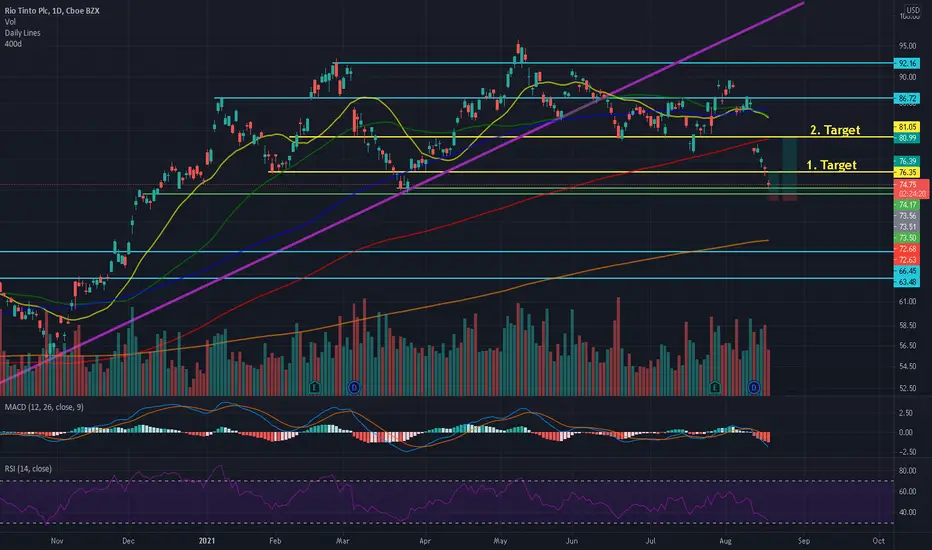
This one will be a complete technical analysis.
Starting point ->>> support lines 73.50$
- 72.64$ Stopploss
- 75.40$ 1. Target
- 81.05$ 2. Target
Buying reasons
-2 support lines 74.17$+73.50$
-daily: RSI oversold (30 area) + MACD tendencies for a countermovement
Selling points
-weekly+monthly MACD indicates sell down
-weekly+ monthly RSI indicates selldown
-under the SMAs (except for 400)
The violet line shows the general uptrend from 2020 to March where we have a break-out (bearish). This shows us that it is unlikely to get ATH. Therefore, I wrote some easier achievable goals.
So, first target has a risk reward ratio of 3.11 with +3.8% upside. Second has risk reward ratio of 8.6 with +10% upside, both with a 1.2% stoploss. The stopploss is based on a Fibonacci retracement.

Thông báo miễn trừ trách nhiệm
Thông tin và các ấn phẩm này không nhằm mục đích, và không cấu thành, lời khuyên hoặc khuyến nghị về tài chính, đầu tư, giao dịch hay các loại khác do TradingView cung cấp hoặc xác nhận. Đọc thêm tại Điều khoản Sử dụng.
Thông báo miễn trừ trách nhiệm
Thông tin và các ấn phẩm này không nhằm mục đích, và không cấu thành, lời khuyên hoặc khuyến nghị về tài chính, đầu tư, giao dịch hay các loại khác do TradingView cung cấp hoặc xác nhận. Đọc thêm tại Điều khoản Sử dụng.