Hello Team! 👋
Have you seen the RKT chart today?
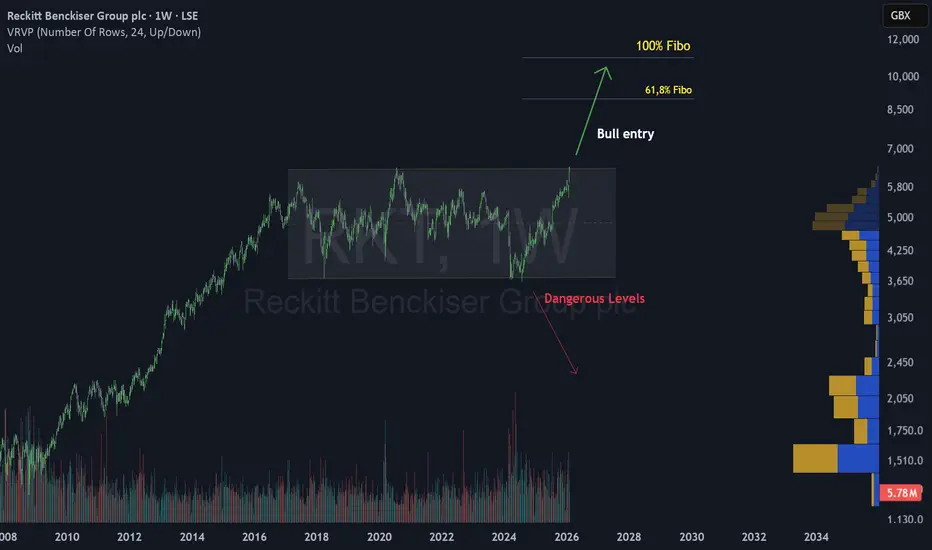
After a prolonged consolidation phase within a massive horizontal range, price is finally showing signs of life. We are currently witnessing a potential structural shift as the price approaches the upper boundary of this multi-year accumulation zone. The Bull entry signal is flashing as we challenge the previous resistance.
Looking at the Volume Profile (VRVP), we can see a significant cluster of trading activity at lower levels, which now acts as a solid floor for the current move. The liquidity at the top of the range is being tested, and a decisive move here could change the long-term trend.
From this technical setup, two main scenarios are in focus:
As long as the price remains above the breakout point and uses the old resistance as new support, the overall outlook remains bullish. Remember that patience is key when trading multi-year breakouts, wait for confirmation and always prioritize risk management.
What do you think? IsRKT ready for the 100% Fibo target? Let me know in the comments!
👇 WANT MORE?
🚀 Hit the rocket, read my profile and follow so we can find each other again.
Have you seen the
RKT chart today?After a prolonged consolidation phase within a massive horizontal range, price is finally showing signs of life. We are currently witnessing a potential structural shift as the price approaches the upper boundary of this multi-year accumulation zone. The Bull entry signal is flashing as we challenge the previous resistance.
Looking at the Volume Profile (VRVP), we can see a significant cluster of trading activity at lower levels, which now acts as a solid floor for the current move. The liquidity at the top of the range is being tested, and a decisive move here could change the long-term trend.
From this technical setup, two main scenarios are in focus:
- Scenario 1: A confirmed weekly breakout above the range high. If the price manages to hold this level, it could trigger a powerful continuation toward the 61.8% Fibo and eventually the 100% Fibo target near 11,000 GBX.
- Scenario 2: A rejection at this key resistance area. If the price fails to sustain the breakout, we could see a retreat back into the range to hunt for more liquidity. A slide toward the "Dangerous Levels" marked on the chart would invalidate the immediate bullish bias.
As long as the price remains above the breakout point and uses the old resistance as new support, the overall outlook remains bullish. Remember that patience is key when trading multi-year breakouts, wait for confirmation and always prioritize risk management.
What do you think? Is
RKT ready for the 100% Fibo target? Let me know in the comments!👇 WANT MORE?
🚀 Hit the rocket, read my profile and follow so we can find each other again.

Most days the market gives you nothing worth playing.
A few times a month it hands you two aces ♠️♦️.
I tell you when that happens & why, after studying more than 8 million patterns across 30 years.
👉topchartpatterns.substack.com/embed
A few times a month it hands you two aces ♠️♦️.
I tell you when that happens & why, after studying more than 8 million patterns across 30 years.
👉topchartpatterns.substack.com/embed
Bài đăng liên quan
Thông báo miễn trừ trách nhiệm
Thông tin và các ấn phẩm này không nhằm mục đích, và không cấu thành, lời khuyên hoặc khuyến nghị về tài chính, đầu tư, giao dịch hay các loại khác do TradingView cung cấp hoặc xác nhận. Đọc thêm tại Điều khoản Sử dụng.
Most days the market gives you nothing worth playing.
A few times a month it hands you two aces ♠️♦️.
I tell you when that happens & why, after studying more than 8 million patterns across 30 years.
👉topchartpatterns.substack.com/embed
A few times a month it hands you two aces ♠️♦️.
I tell you when that happens & why, after studying more than 8 million patterns across 30 years.
👉topchartpatterns.substack.com/embed
Bài đăng liên quan
Thông báo miễn trừ trách nhiệm
Thông tin và các ấn phẩm này không nhằm mục đích, và không cấu thành, lời khuyên hoặc khuyến nghị về tài chính, đầu tư, giao dịch hay các loại khác do TradingView cung cấp hoặc xác nhận. Đọc thêm tại Điều khoản Sử dụng.