Cập nhật
$ROSE/#BTC [#Oasis Netw
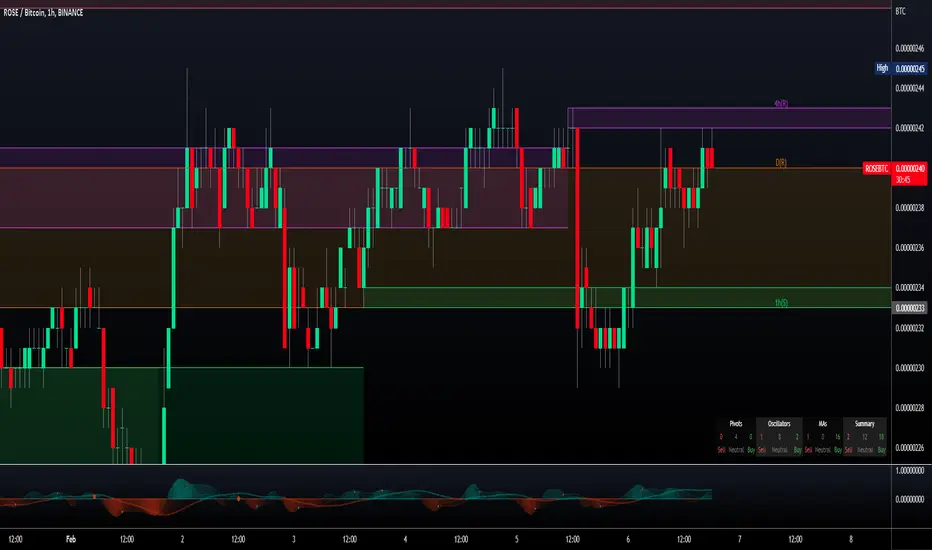
Hey traders, we've identified a Bollinger Band breakout on the  ROSE /
  BTC chart. The price has moved outside of the upper Bollinger Band, which can indicate a potential bullish trend. The next resistance key levels are at 0.00000249 | 0.00000264 | 0.00000295 and the major support zones are respectively at 0.00000218 | 0.00000202 | 0.00000171. We may consider buying at the current price zone 0.0000024 and targetting higher levels.
Technical Metrics:
Current price: 0.0000024
24H Volume: 21.8039 Ƀ
24H Price change: 3.896%
- Pivot Points - Levels:
Resistance: 0.00000249 | 0.00000264 | 0.00000295
Support: 0.00000218 | 0.00000202 | 0.00000171
Indicators recommandation:
Oscillators: NEUTRAL
Moving Averages: STRONG_BUY
Technical Indicators Summary: BUY
- In-depth ROSEBTC technical analysis on > Tradingview TA page

ROSE / BTC chart. The price has moved outside of the upper Bollinger Band, which can indicate a potential bullish trend. The next resistance key levels are at 0.00000249 | 0.00000264 | 0.00000295 and the major support zones are respectively at 0.00000218 | 0.00000202 | 0.00000171. We may consider buying at the current price zone 0.0000024 and targetting higher levels.Technical Metrics:
Current price: 0.0000024
24H Volume: 21.8039 Ƀ
24H Price change: 3.896%
- Pivot Points - Levels:
Resistance: 0.00000249 | 0.00000264 | 0.00000295
Support: 0.00000218 | 0.00000202 | 0.00000171
Indicators recommandation:
Oscillators: NEUTRAL
Moving Averages: STRONG_BUY
Technical Indicators Summary: BUY
- In-depth ROSEBTC technical analysis on > Tradingview TA page
Ghi chú
🚀 #ROSE/BTC well played as expected in our TA by reaching the 0.00000264 resistance level.💰 +09% gain since our entry at 0.00000240

Thông báo miễn trừ trách nhiệm
Thông tin và các ấn phẩm này không nhằm mục đích, và không cấu thành, lời khuyên hoặc khuyến nghị về tài chính, đầu tư, giao dịch hay các loại khác do TradingView cung cấp hoặc xác nhận. Đọc thêm tại Điều khoản Sử dụng.
Thông báo miễn trừ trách nhiệm
Thông tin và các ấn phẩm này không nhằm mục đích, và không cấu thành, lời khuyên hoặc khuyến nghị về tài chính, đầu tư, giao dịch hay các loại khác do TradingView cung cấp hoặc xác nhận. Đọc thêm tại Điều khoản Sử dụng.