
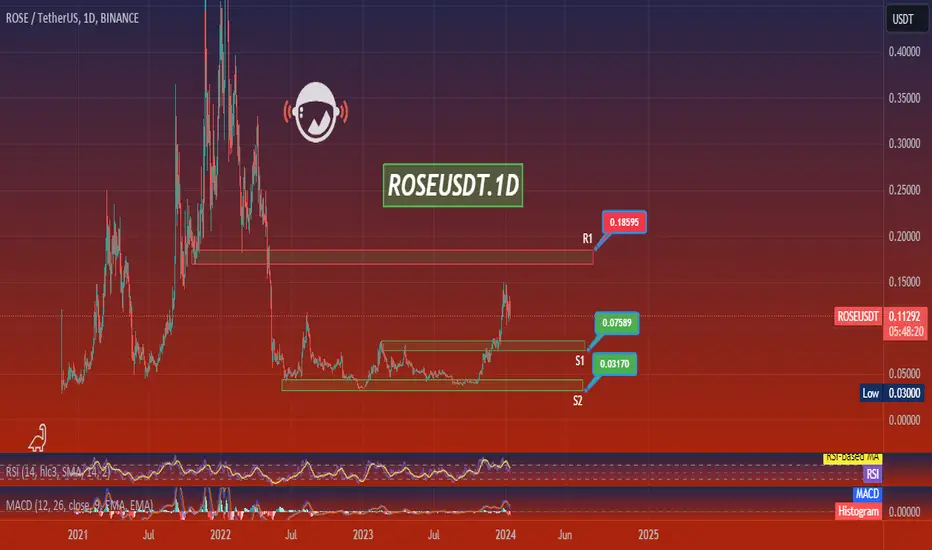
Based on the given market data, the ROSE/USDT pair is currently priced at 0.11314 USDT.
On the 4-hour chart, the Relative Strength Index (RSI) is at 37.11, indicating that the pair is nearing oversold territory. The Moving Average Convergence Divergence (MACD) is at -0.00219, suggesting a bearish sentiment. The Bollinger Band (BB) is at 0.13411, indicating that the pair is trading within a relatively narrow range. The support levels are at 0.11305, 0.10191, and 0.08713 respectively, while the resistance levels are at 0.13411, 0.14678, and 0.15047 respectively.
On the daily chart, the RSI is at 49.24, indicating a neutral market sentiment. The MACD is at 0.00347, suggesting a slight bullish sentiment. The BB is at 0.14255, indicating that the pair is trading within a relatively narrow range. The support levels are at 0.076, 0.061, and 0.034 respectively, while the resistance levels are at 0.15, 0.16, and 0.18 respectively.
On the 7-day chart, the RSI is at 73.51, indicating that the pair is in overbought territory and may be due for a correction. The MACD is at 0.01816, suggesting a strong bullish sentiment. The BB is at 0.13338, indicating that the pair is trading within a relatively narrow range. The support levels are at 0.071, 0.043, and 0.029 respectively, while the resistance levels are at 0.1857, 0.25, and 0.33 respectively.
In my opinion, although the pair shows a strong bullish sentiment on the 7-day chart, the 4-hour chart shows that it is nearing oversold territory, which means there may be a potential for a price reversal in the short term. However, considering the overall market conditions and technical indicators, it is crucial to manage risk and place stop losses wisely while trading.
On the 4-hour chart, the Relative Strength Index (RSI) is at 37.11, indicating that the pair is nearing oversold territory. The Moving Average Convergence Divergence (MACD) is at -0.00219, suggesting a bearish sentiment. The Bollinger Band (BB) is at 0.13411, indicating that the pair is trading within a relatively narrow range. The support levels are at 0.11305, 0.10191, and 0.08713 respectively, while the resistance levels are at 0.13411, 0.14678, and 0.15047 respectively.
On the daily chart, the RSI is at 49.24, indicating a neutral market sentiment. The MACD is at 0.00347, suggesting a slight bullish sentiment. The BB is at 0.14255, indicating that the pair is trading within a relatively narrow range. The support levels are at 0.076, 0.061, and 0.034 respectively, while the resistance levels are at 0.15, 0.16, and 0.18 respectively.
On the 7-day chart, the RSI is at 73.51, indicating that the pair is in overbought territory and may be due for a correction. The MACD is at 0.01816, suggesting a strong bullish sentiment. The BB is at 0.13338, indicating that the pair is trading within a relatively narrow range. The support levels are at 0.071, 0.043, and 0.029 respectively, while the resistance levels are at 0.1857, 0.25, and 0.33 respectively.
In my opinion, although the pair shows a strong bullish sentiment on the 7-day chart, the 4-hour chart shows that it is nearing oversold territory, which means there may be a potential for a price reversal in the short term. However, considering the overall market conditions and technical indicators, it is crucial to manage risk and place stop losses wisely while trading.

Thông báo miễn trừ trách nhiệm
Thông tin và các ấn phẩm này không nhằm mục đích, và không cấu thành, lời khuyên hoặc khuyến nghị về tài chính, đầu tư, giao dịch hay các loại khác do TradingView cung cấp hoặc xác nhận. Đọc thêm tại Điều khoản Sử dụng.
Thông báo miễn trừ trách nhiệm
Thông tin và các ấn phẩm này không nhằm mục đích, và không cấu thành, lời khuyên hoặc khuyến nghị về tài chính, đầu tư, giao dịch hay các loại khác do TradingView cung cấp hoặc xác nhận. Đọc thêm tại Điều khoản Sử dụng.