
📌 Current Price
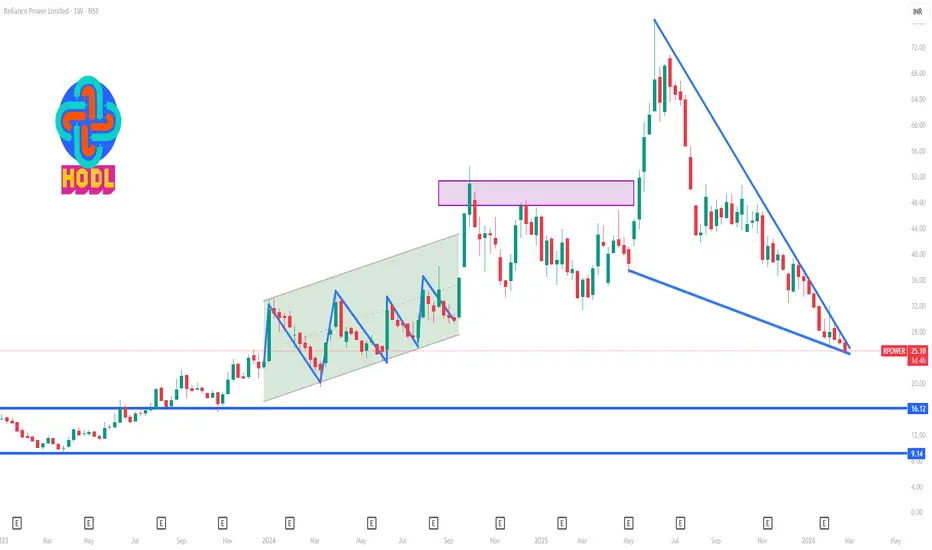
• RPOWER is trading around ₹25 – ₹25.4 per share, near its 52-week low.
📈 1-Week Timeframe: Key Levels to Watch
🔹 Immediate Support Levels
₹24.9–₹25.0 — very near current low range and 52-week support zone.
₹23.5–₹24.0 — secondary support if breakdown below current low happens (psychological + round number). Estimated from recent price levels.
🔸 Immediate Resistance Levels
₹26.5–₹27.0 — nearest short-term resistance zone (recent recent range high candles). Derived from price swings on chart.
₹28.0–₹29.0 — next layer where sellers are often visible for this stock in recent consolidation behaviour. Standard resistance cluster based on price swings.
⭐ 1-Week Trading Range (estimated)
Downside bearish range: ~ ₹24.5–₹25
Upside bullish range (if bounce): ~ ₹26.5–₹28
👉 In the very short term, the price tends to trade in a narrow range with the above support/resistance until a clear breakout or breakdown occurs.
📊 Technical Indicators (Context)
• Current price is extremely close to its lowest weekly levels of the past year → indicates oversold territory in weekly timeframe.
• If price breaks and closes below ₹24.9, weekly momentum could extend further downward.
• A sustained move above ₹27 would indicate a short-term bounce.
• RPOWER is trading around ₹25 – ₹25.4 per share, near its 52-week low.
📈 1-Week Timeframe: Key Levels to Watch
🔹 Immediate Support Levels
₹24.9–₹25.0 — very near current low range and 52-week support zone.
₹23.5–₹24.0 — secondary support if breakdown below current low happens (psychological + round number). Estimated from recent price levels.
🔸 Immediate Resistance Levels
₹26.5–₹27.0 — nearest short-term resistance zone (recent recent range high candles). Derived from price swings on chart.
₹28.0–₹29.0 — next layer where sellers are often visible for this stock in recent consolidation behaviour. Standard resistance cluster based on price swings.
⭐ 1-Week Trading Range (estimated)
Downside bearish range: ~ ₹24.5–₹25
Upside bullish range (if bounce): ~ ₹26.5–₹28
👉 In the very short term, the price tends to trade in a narrow range with the above support/resistance until a clear breakout or breakdown occurs.
📊 Technical Indicators (Context)
• Current price is extremely close to its lowest weekly levels of the past year → indicates oversold territory in weekly timeframe.
• If price breaks and closes below ₹24.9, weekly momentum could extend further downward.
• A sustained move above ₹27 would indicate a short-term bounce.

Contact Knowledgehub for a detailed consultation: Dm on WhatsApp: [wa.link/a2o0kz]-
Phone No: [+91 93102 26243]-
Email: [tradingviewknowledgehub@gmail.com]---
-- Let’s achieve success together!
Phone No: [+91 93102 26243]-
Email: [tradingviewknowledgehub@gmail.com]---
-- Let’s achieve success together!
Bài đăng liên quan
Thông báo miễn trừ trách nhiệm
Thông tin và các ấn phẩm này không nhằm mục đích, và không cấu thành, lời khuyên hoặc khuyến nghị về tài chính, đầu tư, giao dịch hay các loại khác do TradingView cung cấp hoặc xác nhận. Đọc thêm tại Điều khoản Sử dụng.
Contact Knowledgehub for a detailed consultation: Dm on WhatsApp: [wa.link/a2o0kz]-
Phone No: [+91 93102 26243]-
Email: [tradingviewknowledgehub@gmail.com]---
-- Let’s achieve success together!
Phone No: [+91 93102 26243]-
Email: [tradingviewknowledgehub@gmail.com]---
-- Let’s achieve success together!
Bài đăng liên quan
Thông báo miễn trừ trách nhiệm
Thông tin và các ấn phẩm này không nhằm mục đích, và không cấu thành, lời khuyên hoặc khuyến nghị về tài chính, đầu tư, giao dịch hay các loại khác do TradingView cung cấp hoặc xác nhận. Đọc thêm tại Điều khoản Sử dụng.