Russell 2000: Don't Let the Fake Move Cheat You Out of a 20% Rally
For the past few years, the RUSSELL has been a master of frustration. If you feel like this index has been moving sideways forever, you are right. However, there is a very specific pattern repeating itself that most retail traders are missing.
The market is not just moving randomly, it is hunting for liquidity before making its big moves.
The Anatomy of the Fake Out
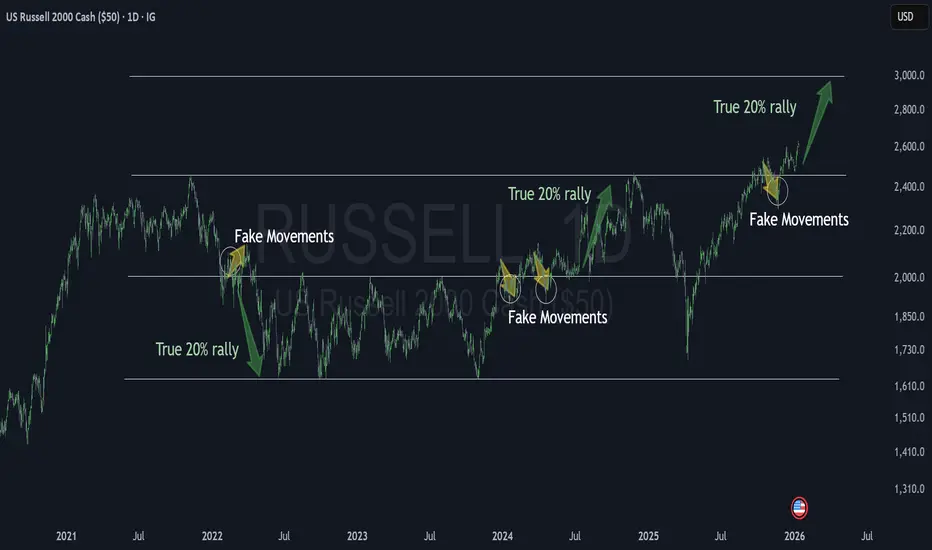
Looking at the chart, we can see that the Russell has been moving between clear zones since 2021. But here is the trick, every time the price prepares to leave a zone and start a major trend, it performs a Fake Movement.
When the price breaks a level or approaches a support/resistance, then quickly reverses. This is a TRAP.
This move is designed to hit the Stop Losses of early traders.
Once those stops are hit, the market has the fuel it needs to launch a True 20% rally in just a few weeks.
We saw this happen in early 2022 and again throughout 2024. Each time the Fake Movement ended, a massive, fast vertical move followed.
Where We Stand Now
What we are seeing here is the start of the next big phase. The index has finally broken above the massive resistance zone around $2,400.
Just as expected, we recently saw a dip, a Fake Movement, where the price touched the breakout zone again. This scared many buyers out of their positions. But look at the green arrow, the path is now clear for a 3,000 target.
💡 The Trading Plan: Riding the 20% Wave
This setup offers a magnificent risk-to-reward ratio because we are entering new territory for the index.
Any small pullback to the breakout line is a gift for buyers or the break of any consolidation zone in this new territory.
To keep the risk tight, a close back inside the old range (below 2,350) could invalidate this idea.
The market is giving us a clear signal. We are no longer in a boring range, we are in a breakout phase fueled by the weak hands that were just stopped out.
👇 WANT MORE?
🚀 Hit the rocket, read my profile and follow so we can find each other again :)
For the past few years, the
RUSSELL has been a master of frustration. If you feel like this index has been moving sideways forever, you are right. However, there is a very specific pattern repeating itself that most retail traders are missing.The market is not just moving randomly, it is hunting for liquidity before making its big moves.
The Anatomy of the Fake Out
Looking at the chart, we can see that the Russell has been moving between clear zones since 2021. But here is the trick, every time the price prepares to leave a zone and start a major trend, it performs a Fake Movement.
When the price breaks a level or approaches a support/resistance, then quickly reverses. This is a TRAP.
This move is designed to hit the Stop Losses of early traders.
Once those stops are hit, the market has the fuel it needs to launch a True 20% rally in just a few weeks.
We saw this happen in early 2022 and again throughout 2024. Each time the Fake Movement ended, a massive, fast vertical move followed.
Where We Stand Now
What we are seeing here is the start of the next big phase. The index has finally broken above the massive resistance zone around $2,400.
Just as expected, we recently saw a dip, a Fake Movement, where the price touched the breakout zone again. This scared many buyers out of their positions. But look at the green arrow, the path is now clear for a 3,000 target.
💡 The Trading Plan: Riding the 20% Wave
This setup offers a magnificent risk-to-reward ratio because we are entering new territory for the index.
Any small pullback to the breakout line is a gift for buyers or the break of any consolidation zone in this new territory.
To keep the risk tight, a close back inside the old range (below 2,350) could invalidate this idea.
The market is giving us a clear signal. We are no longer in a boring range, we are in a breakout phase fueled by the weak hands that were just stopped out.
👇 WANT MORE?
🚀 Hit the rocket, read my profile and follow so we can find each other again :)

🚀 Simple Chart Patterns. Serious Profits.
📈 +200% returns
🎯 70%+ win rate (audited)
Trade smarter, not harder.
👉topchartpatterns.substack.com/subscribe
📩 Business: info@topchartpatterns.com
📈 +200% returns
🎯 70%+ win rate (audited)
Trade smarter, not harder.
👉topchartpatterns.substack.com/subscribe
📩 Business: info@topchartpatterns.com
Bài đăng liên quan
Thông báo miễn trừ trách nhiệm
Thông tin và các ấn phẩm này không nhằm mục đích, và không cấu thành, lời khuyên hoặc khuyến nghị về tài chính, đầu tư, giao dịch hay các loại khác do TradingView cung cấp hoặc xác nhận. Đọc thêm tại Điều khoản Sử dụng.
🚀 Simple Chart Patterns. Serious Profits.
📈 +200% returns
🎯 70%+ win rate (audited)
Trade smarter, not harder.
👉topchartpatterns.substack.com/subscribe
📩 Business: info@topchartpatterns.com
📈 +200% returns
🎯 70%+ win rate (audited)
Trade smarter, not harder.
👉topchartpatterns.substack.com/subscribe
📩 Business: info@topchartpatterns.com
Bài đăng liên quan
Thông báo miễn trừ trách nhiệm
Thông tin và các ấn phẩm này không nhằm mục đích, và không cấu thành, lời khuyên hoặc khuyến nghị về tài chính, đầu tư, giao dịch hay các loại khác do TradingView cung cấp hoặc xác nhận. Đọc thêm tại Điều khoản Sử dụng.