
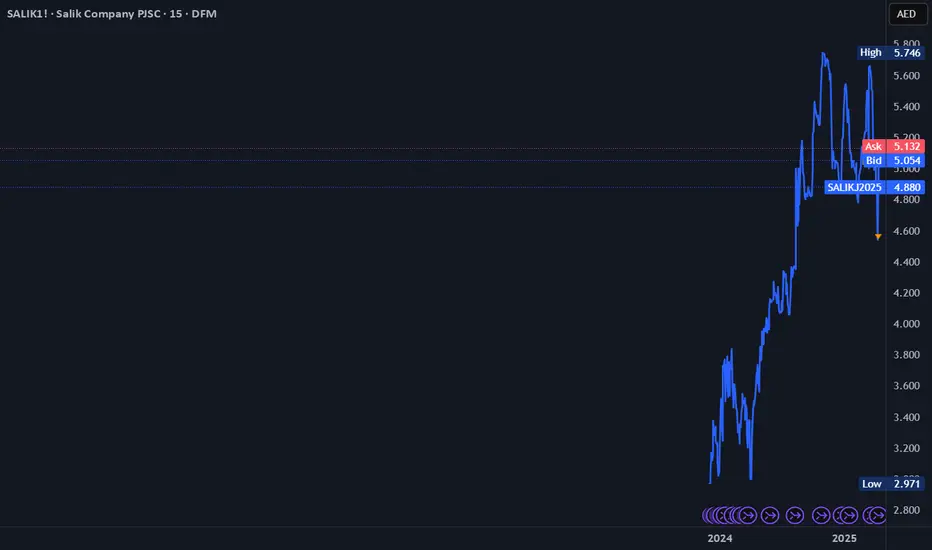
Current Price: AED 5.02
Daily Change: Decrease of AED 0.08 (-1.57%)
52-Week Range:
Low: AED 3.14
High: AED 5.89
Since its IPO in September 2022 at AED 2 per share, Salik has shown impressive growth of approximately 151% to date.
Performance vs. DFMGI (Dubai Financial Market General Index)
Salik has significantly outperformed the Dubai Financial Market Index.
Salik stock: +151% since IPO
DFMGI: Moderate growth over the same period
Technical Analysis
Moving Averages:
These indicators suggest the stock is in a sideways trend, with no clear upward or downward direction.
Support & Resistance Levels
A breakout above the resistance level could signal further gains, while a break below support might indicate potential downside.
Daily Change: Decrease of AED 0.08 (-1.57%)
52-Week Range:
Low: AED 3.14
High: AED 5.89
Since its IPO in September 2022 at AED 2 per share, Salik has shown impressive growth of approximately 151% to date.
Performance vs. DFMGI (Dubai Financial Market General Index)
Salik has significantly outperformed the Dubai Financial Market Index.
Salik stock: +151% since IPO
DFMGI: Moderate growth over the same period
Technical Analysis
- (Relative Strength Index): 51.9 → Neutral (no overbought or oversold signals)
- MACD (Moving Average Convergence Divergence): 0 → Momentum is balanced
- ADX (Average Directional Index): 27.1 → Indicates a weak trend
Moving Averages:
- 5-day MA: AED 5.09 → Buy signal
- 10-day MA: AED 5.06 → Buy signal
- 50-day MA: AED 5.10 → Sell signal
These indicators suggest the stock is in a sideways trend, with no clear upward or downward direction.
Support & Resistance Levels
- Support: AED 5.02
- Resistance: AED 5.18
A breakout above the resistance level could signal further gains, while a break below support might indicate potential downside.

Thông báo miễn trừ trách nhiệm
Thông tin và các ấn phẩm này không nhằm mục đích, và không cấu thành, lời khuyên hoặc khuyến nghị về tài chính, đầu tư, giao dịch hay các loại khác do TradingView cung cấp hoặc xác nhận. Đọc thêm tại Điều khoản Sử dụng.
Thông báo miễn trừ trách nhiệm
Thông tin và các ấn phẩm này không nhằm mục đích, và không cấu thành, lời khuyên hoặc khuyến nghị về tài chính, đầu tư, giao dịch hay các loại khác do TradingView cung cấp hoặc xác nhận. Đọc thêm tại Điều khoản Sử dụng.