
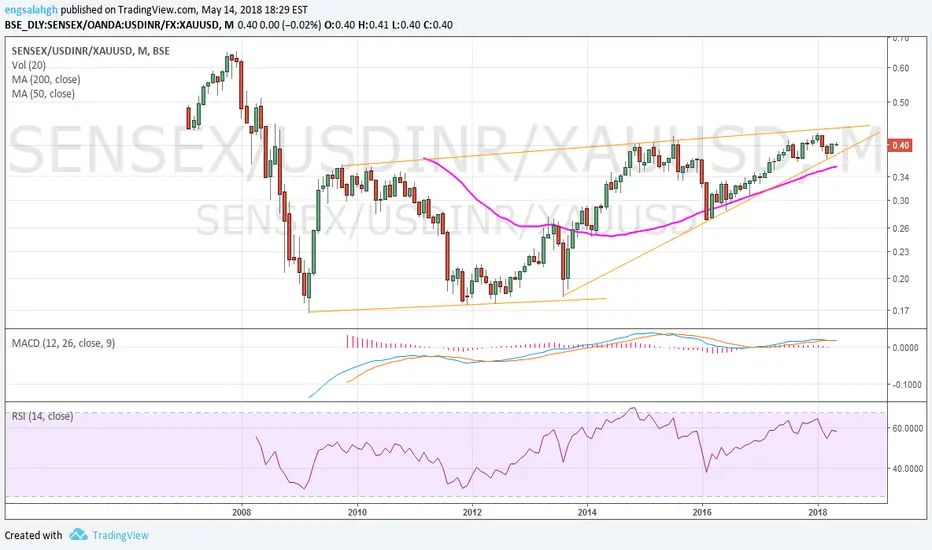
The chart of Sensex index in terms of gold.
It don't give a long history, only 11 years.
I ran this chart to answer a specific question;
Will a nuclear war happen?
At least, will India participate in such thing?
A country with booming market reflect a very positive social mood will not engage in a war.
I don't have long enough historic data to get the big picture (at least 20 years of data.)
As the chart show:
1) We have a double bottom and a support line, and
2) A triangle on the right side of the chart.
These tow things suggest that Sensex index and the Indian market as a hall will boom (in terms of gold) in the coming years, hence India will not go to war.
It don't give a long history, only 11 years.
I ran this chart to answer a specific question;
Will a nuclear war happen?
At least, will India participate in such thing?
A country with booming market reflect a very positive social mood will not engage in a war.
I don't have long enough historic data to get the big picture (at least 20 years of data.)
As the chart show:
1) We have a double bottom and a support line, and
2) A triangle on the right side of the chart.
These tow things suggest that Sensex index and the Indian market as a hall will boom (in terms of gold) in the coming years, hence India will not go to war.

Thông báo miễn trừ trách nhiệm
Thông tin và các ấn phẩm này không nhằm mục đích, và không cấu thành, lời khuyên hoặc khuyến nghị về tài chính, đầu tư, giao dịch hay các loại khác do TradingView cung cấp hoặc xác nhận. Đọc thêm tại Điều khoản Sử dụng.
Thông báo miễn trừ trách nhiệm
Thông tin và các ấn phẩm này không nhằm mục đích, và không cấu thành, lời khuyên hoặc khuyến nghị về tài chính, đầu tư, giao dịch hay các loại khác do TradingView cung cấp hoặc xác nhận. Đọc thêm tại Điều khoản Sử dụng.