Giá mua
$SHOP Towards $70
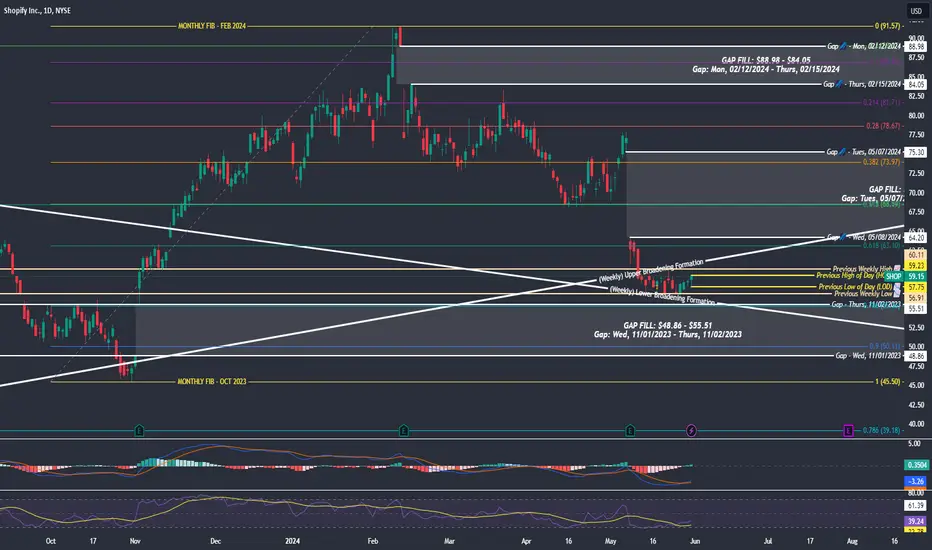
What do we see here?
- $NYSE:SHOP ended the day with a bullish outside day.
- Previous HOD for May 31 is $59.23, can serve as resistance.
- Previous weekly high is $60.11 and can also serve as resistance.
- GAP to be filled to the upside $64.20 - $75.30.
- RSI is at 39.24 and moving upwards slowly.
- MACD (blue line) is above the signal (orange line), indicates continued bullish movement
- 5-month monthly fibonacci patterns highlights potential resistance on 0.618 ($63.10) and 0.5 ($68.54) (which is the 0.618 of a bullish fib pattern on a larger time block
- GAP also potentially to be filled to the downside $55.51 - $48.86)

Bài đăng liên quan
Thông báo miễn trừ trách nhiệm
Thông tin và các ấn phẩm này không nhằm mục đích, và không cấu thành, lời khuyên hoặc khuyến nghị về tài chính, đầu tư, giao dịch hay các loại khác do TradingView cung cấp hoặc xác nhận. Đọc thêm tại Điều khoản Sử dụng.
Bài đăng liên quan
Thông báo miễn trừ trách nhiệm
Thông tin và các ấn phẩm này không nhằm mục đích, và không cấu thành, lời khuyên hoặc khuyến nghị về tài chính, đầu tư, giao dịch hay các loại khác do TradingView cung cấp hoặc xác nhận. Đọc thêm tại Điều khoản Sử dụng.