
If you're here it probably means you do just like me.
So here's what I've dug out,
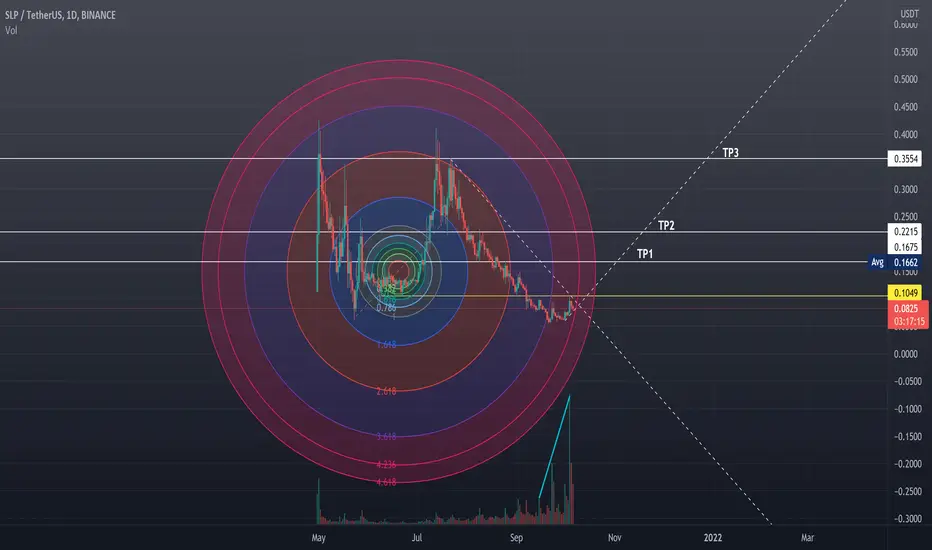
first look at the volume at the bottom of the chart
Second the chart seems to indicate that a REALLY insane pump will take place right around the corner if it successfully holds the current trend for 3-4 days.
thirdly, the chart simply looks like a giga double bottom forming.
and lastly, there's the Fib 4.236 looking primed up for a price increase.
**DYOR** This chart is only one data point and my personal forecast based on what I see, don't make an investment based only on this chart.

Thông báo miễn trừ trách nhiệm
Thông tin và các ấn phẩm này không nhằm mục đích, và không cấu thành, lời khuyên hoặc khuyến nghị về tài chính, đầu tư, giao dịch hay các loại khác do TradingView cung cấp hoặc xác nhận. Đọc thêm tại Điều khoản Sử dụng.
Thông báo miễn trừ trách nhiệm
Thông tin và các ấn phẩm này không nhằm mục đích, và không cấu thành, lời khuyên hoặc khuyến nghị về tài chính, đầu tư, giao dịch hay các loại khác do TradingView cung cấp hoặc xác nhận. Đọc thêm tại Điều khoản Sử dụng.