
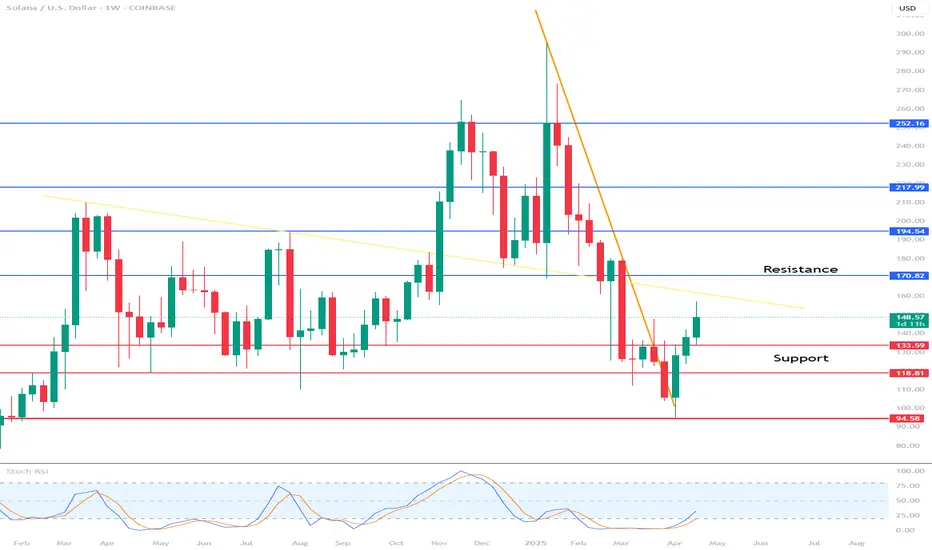
Hi everyone, let's look at the 1W SOL to USD chart, in this situation we can see how the price came out sideways from the downtrend line which gave a bounce, however here it is worth paying attention to the trend line that was in force before the last price peak and here we can see that the price is still below this line.
Let's start by defining the targets for the near future that the price has to face:
T1 = 171 USD
T2 = 195 USD
Т3 = 218 USD
Т4 = 252 USD
Now let's move on to the stop-loss in case the market continues to fall:
SL1 = 134 USD
SL2 = 119 USD
SL3 = 95 USD
If we look at the RSI indicator, we can see how the bounce gave a return to the lower part of the range which still indicates that we have a lot of room to continue the started increases.
Let's start by defining the targets for the near future that the price has to face:
T1 = 171 USD
T2 = 195 USD
Т3 = 218 USD
Т4 = 252 USD
Now let's move on to the stop-loss in case the market continues to fall:
SL1 = 134 USD
SL2 = 119 USD
SL3 = 95 USD
If we look at the RSI indicator, we can see how the bounce gave a return to the lower part of the range which still indicates that we have a lot of room to continue the started increases.

Thông báo miễn trừ trách nhiệm
Thông tin và các ấn phẩm này không nhằm mục đích, và không cấu thành, lời khuyên hoặc khuyến nghị về tài chính, đầu tư, giao dịch hay các loại khác do TradingView cung cấp hoặc xác nhận. Đọc thêm tại Điều khoản Sử dụng.
Thông báo miễn trừ trách nhiệm
Thông tin và các ấn phẩm này không nhằm mục đích, và không cấu thành, lời khuyên hoặc khuyến nghị về tài chính, đầu tư, giao dịch hay các loại khác do TradingView cung cấp hoặc xác nhận. Đọc thêm tại Điều khoản Sử dụng.