
SOL/USDT — Weekly Chart Update
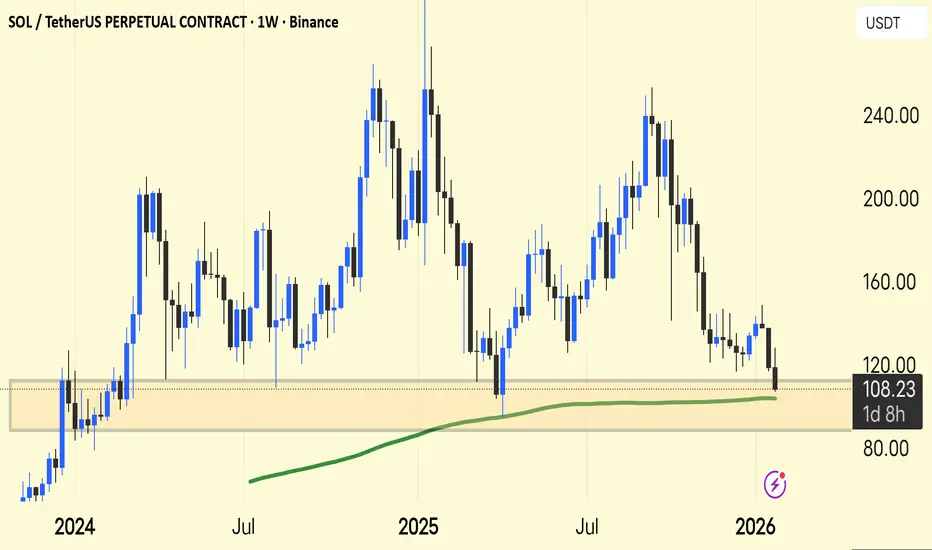
SOL is testing a major demand zone around $100–110, right where price has reacted multiple times before.
The 200-week MA (green) is just below price — a key long-term support area.
Market structure is still lower highs after the $240 peak → medium-term pressure remains.
Hold above $100 = base building & potential bounce toward $130–150.
Weekly close below $100 = risk of deeper pullback toward $80–90.
Summary: This is a make-or-break zone for SOL. Bulls need to defend here to flip momentum.
SOL is testing a major demand zone around $100–110, right where price has reacted multiple times before.
The 200-week MA (green) is just below price — a key long-term support area.
Market structure is still lower highs after the $240 peak → medium-term pressure remains.
Hold above $100 = base building & potential bounce toward $130–150.
Weekly close below $100 = risk of deeper pullback toward $80–90.
Summary: This is a make-or-break zone for SOL. Bulls need to defend here to flip momentum.

Bài đăng liên quan
Thông báo miễn trừ trách nhiệm
Thông tin và các ấn phẩm này không nhằm mục đích, và không cấu thành, lời khuyên hoặc khuyến nghị về tài chính, đầu tư, giao dịch hay các loại khác do TradingView cung cấp hoặc xác nhận. Đọc thêm tại Điều khoản Sử dụng.
Bài đăng liên quan
Thông báo miễn trừ trách nhiệm
Thông tin và các ấn phẩm này không nhằm mục đích, và không cấu thành, lời khuyên hoặc khuyến nghị về tài chính, đầu tư, giao dịch hay các loại khác do TradingView cung cấp hoặc xác nhận. Đọc thêm tại Điều khoản Sử dụng.