SOLUSDT Technical analysis update
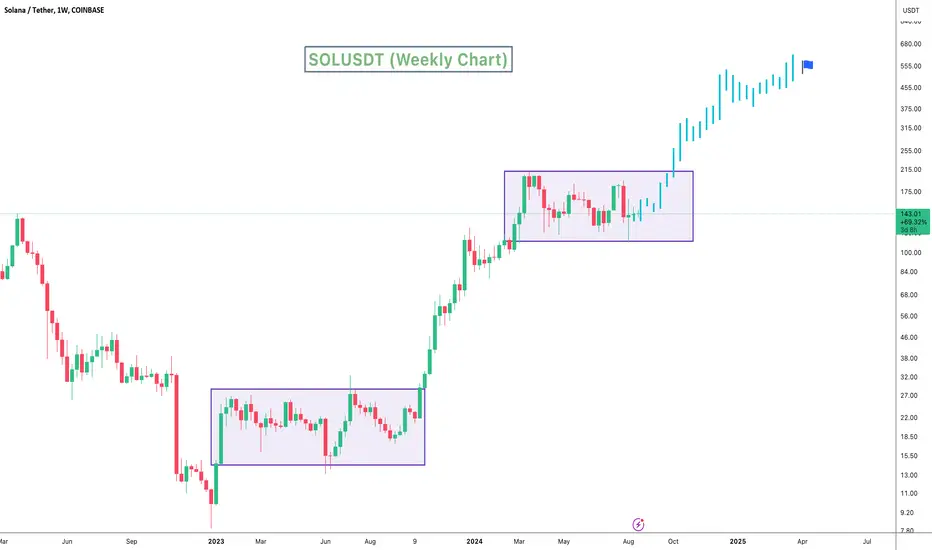
SOL has been forming a rectangle pattern for the last 170 days. The price is now approaching the rectangle's resistance, indicating a potential breakout. If the breakout occurs, we can expect a strong bullish move in SOL, with the price possibly reaching $500 in this bull run.
In day chart 200 EMA act as a good support for SOL
A similar pattern formed at the bottom, where the price stayed within a rectangle for 280 days before breaking the resistance and surging 600%. We could see a similar move once the current rectangle is broken.
Regards
Hexa
SOL has been forming a rectangle pattern for the last 170 days. The price is now approaching the rectangle's resistance, indicating a potential breakout. If the breakout occurs, we can expect a strong bullish move in SOL, with the price possibly reaching $500 in this bull run.
In day chart 200 EMA act as a good support for SOL
A similar pattern formed at the bottom, where the price stayed within a rectangle for 280 days before breaking the resistance and surging 600%. We could see a similar move once the current rectangle is broken.
Regards
Hexa
Ghi chú

 SOLUSDT price moving toward the rectangle pattern resistance for the breakout.
🚀Telegram : t.me/hexatrades
🌐Website: hexatrades.io/
🗣️Twitter(X): twitter.com/HexaTrades
🌐Website: hexatrades.io/
🗣️Twitter(X): twitter.com/HexaTrades
Bài đăng liên quan
Thông báo miễn trừ trách nhiệm
Thông tin và các ấn phẩm này không nhằm mục đích, và không cấu thành, lời khuyên hoặc khuyến nghị về tài chính, đầu tư, giao dịch hay các loại khác do TradingView cung cấp hoặc xác nhận. Đọc thêm tại Điều khoản Sử dụng.
🚀Telegram : t.me/hexatrades
🌐Website: hexatrades.io/
🗣️Twitter(X): twitter.com/HexaTrades
🌐Website: hexatrades.io/
🗣️Twitter(X): twitter.com/HexaTrades
Bài đăng liên quan
Thông báo miễn trừ trách nhiệm
Thông tin và các ấn phẩm này không nhằm mục đích, và không cấu thành, lời khuyên hoặc khuyến nghị về tài chính, đầu tư, giao dịch hay các loại khác do TradingView cung cấp hoặc xác nhận. Đọc thêm tại Điều khoản Sử dụng.