
1. Main trend
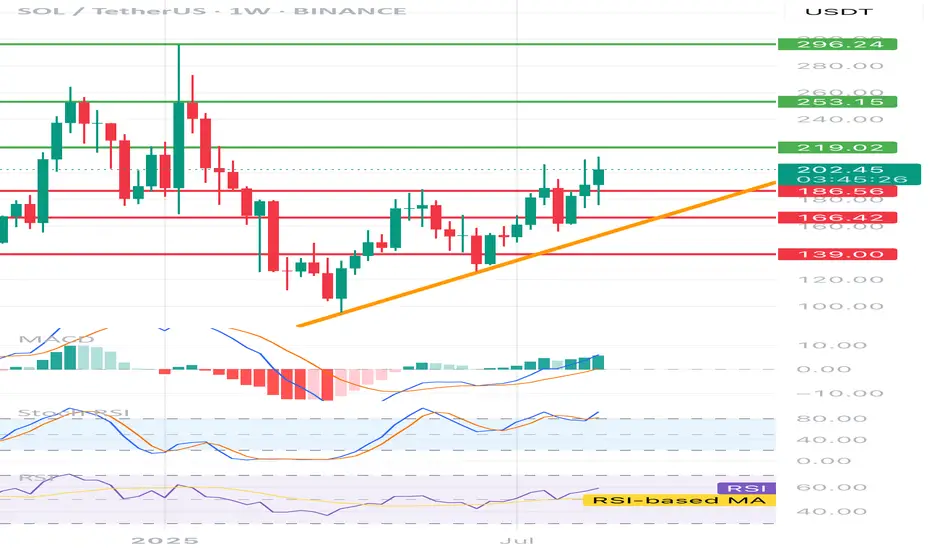
• You can see a strong upward trend from holes around 120 USDT.
• The course currently moves along the growing trend line (orange).
• The last candles show that the buyers are defending support and each hole is higher → a sign of market strength.
⸻
2. Support and resistance (key levels from the chart)
• Support:
• 186.56 USDT - the first strong support (coincides with the trend line).
• 166.42 USDT - another stronger support.
• 139.00 USDT - main strategic support.
• resistance:
• 219.02 USDT - the closest resistance (currently tested).
• 253.15 USDT - strong resistance if 219 is broken.
• 296.24 USDT - another target in the event of a bull market.
⸻
3. Indicators
• MacD - upward signal, lines are above the zero line, green histogram → momentum is growing.
• STOCHASTIC RSI - high, close to the purchase zone → a short correction may occur.
• RSI (classic) - ~ 60 points, i.e. not yet purchased, but the space for increases is reduced.
⸻
4. Scenarios
• Bycza (more likely at the moment):
If the SOL stays above 186 USDT and pierces USDT USDT, subsequent goals are 253 → 296 USDT.
• Bear (alternative):
If the price drops below 186 USDT and breaks the trend line, possible return to 166 and even 139 USDT.
⸻
🔑 Summary
• The trend is upward and still strong.
• Key breakdown is 219 USDT.
• Trend holding (above 186 USDT) = potential for further increases.
• Breaking the trend line = correction warning.
• You can see a strong upward trend from holes around 120 USDT.
• The course currently moves along the growing trend line (orange).
• The last candles show that the buyers are defending support and each hole is higher → a sign of market strength.
⸻
2. Support and resistance (key levels from the chart)
• Support:
• 186.56 USDT - the first strong support (coincides with the trend line).
• 166.42 USDT - another stronger support.
• 139.00 USDT - main strategic support.
• resistance:
• 219.02 USDT - the closest resistance (currently tested).
• 253.15 USDT - strong resistance if 219 is broken.
• 296.24 USDT - another target in the event of a bull market.
⸻
3. Indicators
• MacD - upward signal, lines are above the zero line, green histogram → momentum is growing.
• STOCHASTIC RSI - high, close to the purchase zone → a short correction may occur.
• RSI (classic) - ~ 60 points, i.e. not yet purchased, but the space for increases is reduced.
⸻
4. Scenarios
• Bycza (more likely at the moment):
If the SOL stays above 186 USDT and pierces USDT USDT, subsequent goals are 253 → 296 USDT.
• Bear (alternative):
If the price drops below 186 USDT and breaks the trend line, possible return to 166 and even 139 USDT.
⸻
🔑 Summary
• The trend is upward and still strong.
• Key breakdown is 219 USDT.
• Trend holding (above 186 USDT) = potential for further increases.
• Breaking the trend line = correction warning.

Thông báo miễn trừ trách nhiệm
Thông tin và các ấn phẩm này không nhằm mục đích, và không cấu thành, lời khuyên hoặc khuyến nghị về tài chính, đầu tư, giao dịch hay các loại khác do TradingView cung cấp hoặc xác nhận. Đọc thêm tại Điều khoản Sử dụng.
Thông báo miễn trừ trách nhiệm
Thông tin và các ấn phẩm này không nhằm mục đích, và không cấu thành, lời khuyên hoặc khuyến nghị về tài chính, đầu tư, giao dịch hay các loại khác do TradingView cung cấp hoặc xác nhận. Đọc thêm tại Điều khoản Sử dụng.