
The chart for Soybeans looking very attractive right now. On the daily chart, we have an engulfing candle at a major flip/resistance zone. This has garnered the attention of any technical traders.
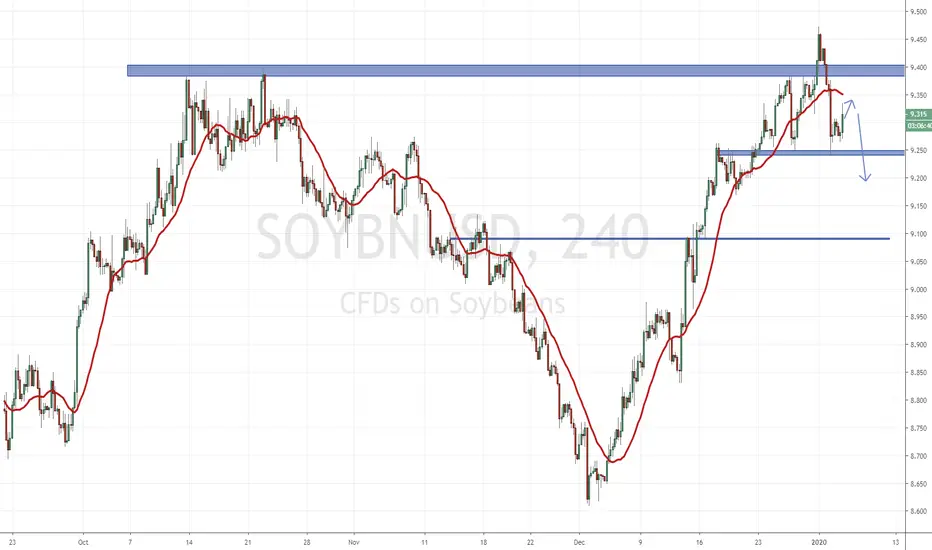
Moving down on the 4 hour, we get a clearer picture. We have been in a nice uptrend with multiple swings, higher lows and higher highs. This trend began to exhaust at the resistance/flip zone and we have had multiple red candles.
Looking for our first lower high confirmation here, and this would come in the form of creating a head and shoulders pattern.
So overall many good confluences for this trade, just awaiting the break of the neckline/support.
Would be looking to take profits at the 9.00 zone on this instrument. Around 935 on futures.
Moving down on the 4 hour, we get a clearer picture. We have been in a nice uptrend with multiple swings, higher lows and higher highs. This trend began to exhaust at the resistance/flip zone and we have had multiple red candles.
Looking for our first lower high confirmation here, and this would come in the form of creating a head and shoulders pattern.
So overall many good confluences for this trade, just awaiting the break of the neckline/support.
Would be looking to take profits at the 9.00 zone on this instrument. Around 935 on futures.

Thông báo miễn trừ trách nhiệm
Thông tin và các ấn phẩm này không nhằm mục đích, và không cấu thành, lời khuyên hoặc khuyến nghị về tài chính, đầu tư, giao dịch hay các loại khác do TradingView cung cấp hoặc xác nhận. Đọc thêm tại Điều khoản Sử dụng.
Thông báo miễn trừ trách nhiệm
Thông tin và các ấn phẩm này không nhằm mục đích, và không cấu thành, lời khuyên hoặc khuyến nghị về tài chính, đầu tư, giao dịch hay các loại khác do TradingView cung cấp hoặc xác nhận. Đọc thêm tại Điều khoản Sử dụng.