S&P 500 Index ( SPX) Daily: Bullish Wedge Rebound off 72-SMA Ribbon Targets 7,647 Expansion Ceiling
### 🇺🇸 USA S&P 500 Index (SPX) Daily Technical Matrix (Ref: SPX_2026-07-29_08-43-59.png)
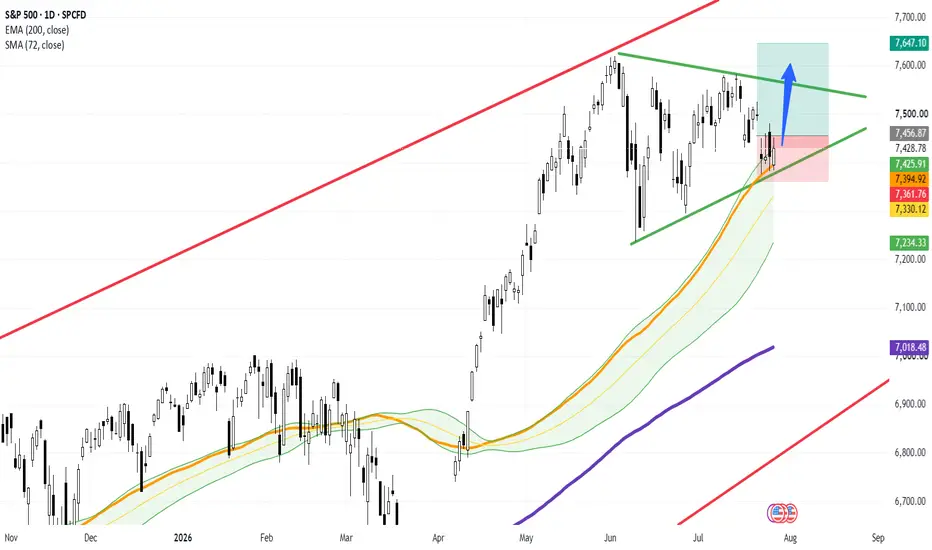
We are releasing a daily (1D) structural framework on the S&P 500 Index (SPX). Following a healthy consolidation cycle within a contracting wedge structure, price action has successfully retested a high-confluence demand zone, springing off dynamic moving average support to initiate a fresh bullish momentum wave.
The index is trading higher today at **7,428.78 (+0.21%)**, demonstrating solid buy-side absorption above key moving average boundaries.
---
### 🔍 Technical Architecture & Dynamic Confluence Node:
Our quantitative framework highlights a textbook continuation pattern on the daily time horizon:
1. **The Contracting Wedge Geometry:** Price action is tightly contained within an ascending wedge consolidation, bounded by a upper descending resistance trendline (green LTB) and an ascending support trendline (green LTA floor).
2. **Dynamic 72-SMA Ribbon Cushion:** The immediate bounce aligns directly with the **72-period SMA ribbon cluster (tracked between 7,330.12 and 7,425.91)**. The strong lower candle wicks validate institutional defense along this dynamic band.
3. **Macro Trend Foundation:** Long-term market health remains firmly intact, supported well above the ascending **200-period EMA (purple line sitting at 7,018.48)**.
---
### 🎯 Tactical Long Execution Framework (Blue Vector Impulse):
The risk-to-reward architecture is highly asymmetric, targeting a breakout of the upper wedge boundary:
* **Tactical Accumulation Corridor:** **7,425.91 – 7,456.87** zone.
* **Protective Stop Loss Anchor:** Positioned below the wedge support floor and 72-SMA ribbon at **7,361.76**.
* **Breakout Trigger Level:** A daily closing candle above the descending resistance trendline near **7,550.00** confirms the wedge breakout.
* **Primary Take Profit Target:** Extended impulse projection aims for the major structural supply ceiling at **7,647.10**.
### 📊 Tactical Parameters Summary:
* **Current Bias:** Bullish Rebound / Wedge Continuation
* **Dynamic Demand Support (72-SMA):** 7,425.91
* **Risk Invalidation Floor (Stop Loss):** 7,361.76
* **Wedge Breakout Resistance:** ~7,550.00
* **Primary Upside Target:** 7,647.10
---
📊 **ChartPro Data**
*US Equity Architecture, Continuation Geometry & Systematic Risk Management.*
⚠️ **Disclaimer:** For educational and informational purposes only. This active market study represents a personal trading framework and does not constitute financial or investment advice.
SPX) Daily: Bullish Wedge Rebound off 72-SMA Ribbon Targets 7,647 Expansion Ceiling### 🇺🇸 USA S&P 500 Index (
SPX) Daily Technical Matrix (Ref: SPX_2026-07-29_08-43-59.png)We are releasing a daily (1D) structural framework on the S&P 500 Index (
SPX). Following a healthy consolidation cycle within a contracting wedge structure, price action has successfully retested a high-confluence demand zone, springing off dynamic moving average support to initiate a fresh bullish momentum wave.The index is trading higher today at **7,428.78 (+0.21%)**, demonstrating solid buy-side absorption above key moving average boundaries.
---
### 🔍 Technical Architecture & Dynamic Confluence Node:
Our quantitative framework highlights a textbook continuation pattern on the daily time horizon:
1. **The Contracting Wedge Geometry:** Price action is tightly contained within an ascending wedge consolidation, bounded by a upper descending resistance trendline (green LTB) and an ascending support trendline (green LTA floor).
2. **Dynamic 72-SMA Ribbon Cushion:** The immediate bounce aligns directly with the **72-period SMA ribbon cluster (tracked between 7,330.12 and 7,425.91)**. The strong lower candle wicks validate institutional defense along this dynamic band.
3. **Macro Trend Foundation:** Long-term market health remains firmly intact, supported well above the ascending **200-period EMA (purple line sitting at 7,018.48)**.
---
### 🎯 Tactical Long Execution Framework (Blue Vector Impulse):
The risk-to-reward architecture is highly asymmetric, targeting a breakout of the upper wedge boundary:
* **Tactical Accumulation Corridor:** **7,425.91 – 7,456.87** zone.
* **Protective Stop Loss Anchor:** Positioned below the wedge support floor and 72-SMA ribbon at **7,361.76**.
* **Breakout Trigger Level:** A daily closing candle above the descending resistance trendline near **7,550.00** confirms the wedge breakout.
* **Primary Take Profit Target:** Extended impulse projection aims for the major structural supply ceiling at **7,647.10**.
### 📊 Tactical Parameters Summary:
* **Current Bias:** Bullish Rebound / Wedge Continuation
* **Dynamic Demand Support (72-SMA):** 7,425.91
* **Risk Invalidation Floor (Stop Loss):** 7,361.76
* **Wedge Breakout Resistance:** ~7,550.00
* **Primary Upside Target:** 7,647.10
---
📊 **ChartPro Data**
*US Equity Architecture, Continuation Geometry & Systematic Risk Management.*
⚠️ **Disclaimer:** For educational and informational purposes only. This active market study represents a personal trading framework and does not constitute financial or investment advice.

Thông báo miễn trừ trách nhiệm
Thông tin và các ấn phẩm này không nhằm mục đích, và không cấu thành, lời khuyên hoặc khuyến nghị về tài chính, đầu tư, giao dịch hay các loại khác do TradingView cung cấp hoặc xác nhận. Đọc thêm tại Điều khoản Sử dụng.
Thông báo miễn trừ trách nhiệm
Thông tin và các ấn phẩm này không nhằm mục đích, và không cấu thành, lời khuyên hoặc khuyến nghị về tài chính, đầu tư, giao dịch hay các loại khác do TradingView cung cấp hoặc xác nhận. Đọc thêm tại Điều khoản Sử dụng.