
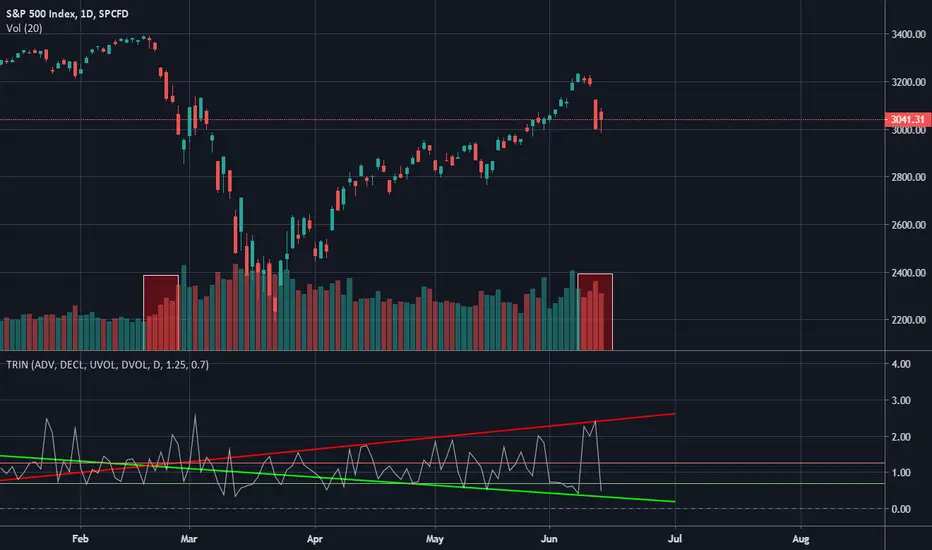
I touched on the TRIN already here...
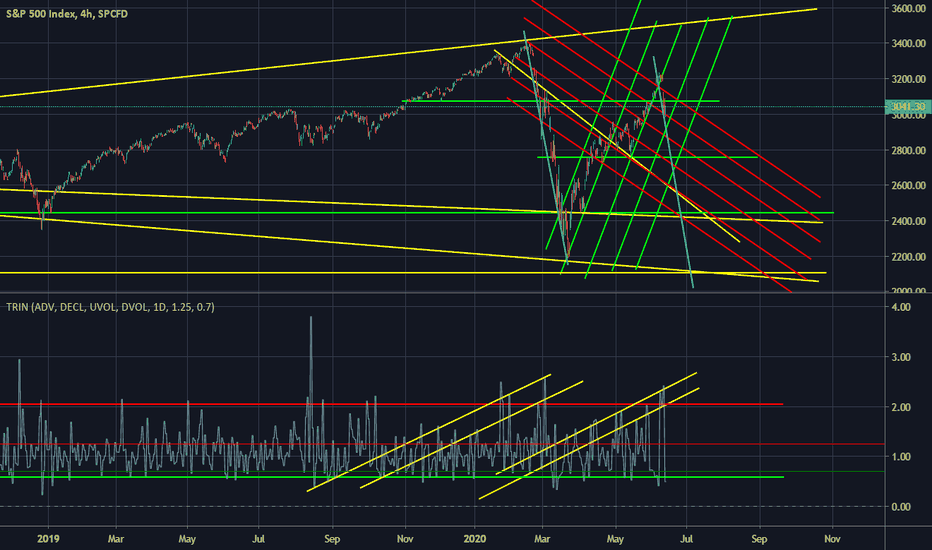
Wanted to take another angle.
Since the bounce, it has followed almost exactly to a megaphone pattern.
Those horizontal red and green lines are the indicator default, above red is SELL below green is BUY and in between in HOLD.
This is leaning very heavily into SELL and consistently holding PANIC SELL levels (>2).
We'll likely see another two red volume bars at least on Mon and Tues and see it flip back to panic sell before settling back under the red line around the green line while crashing down next few weeks.

Data analyst with a passion for best fit lines... B)
Bài đăng liên quan
Thông báo miễn trừ trách nhiệm
Thông tin và các ấn phẩm này không nhằm mục đích, và không cấu thành, lời khuyên hoặc khuyến nghị về tài chính, đầu tư, giao dịch hay các loại khác do TradingView cung cấp hoặc xác nhận. Đọc thêm tại Điều khoản Sử dụng.