
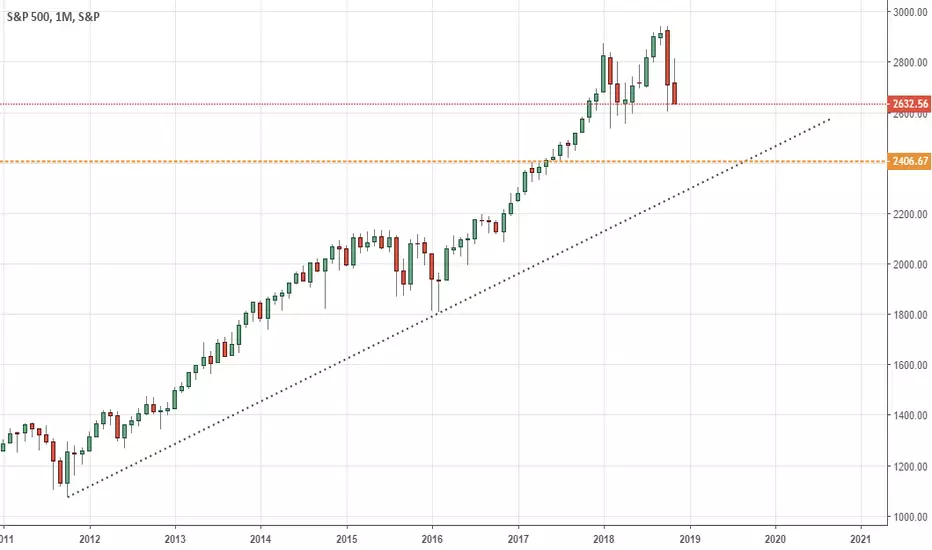
We are looking at a long-term chart that will tell us a lot of information that corresponds to the world economy.
Pay attention to the highlighted areas for a bounce or break!

We will keep an eye on the 2.400 AREA should the price break down further.
* the area with the most momentum is currently the short side because the US economy is fundamentally slowing down at the moment.
For more information:
drive.google.com/open?id=1zkulMZ22W4DY5r7hzHPgkADqMnlUnQ2d
Pay attention to the highlighted areas for a bounce or break!
We will keep an eye on the 2.400 AREA should the price break down further.
* the area with the most momentum is currently the short side because the US economy is fundamentally slowing down at the moment.
For more information:
drive.google.com/open?id=1zkulMZ22W4DY5r7hzHPgkADqMnlUnQ2d
Ghi chú
Coming for the retest

Thông báo miễn trừ trách nhiệm
Thông tin và các ấn phẩm này không nhằm mục đích, và không cấu thành, lời khuyên hoặc khuyến nghị về tài chính, đầu tư, giao dịch hay các loại khác do TradingView cung cấp hoặc xác nhận. Đọc thêm tại Điều khoản Sử dụng.
Thông báo miễn trừ trách nhiệm
Thông tin và các ấn phẩm này không nhằm mục đích, và không cấu thành, lời khuyên hoặc khuyến nghị về tài chính, đầu tư, giao dịch hay các loại khác do TradingView cung cấp hoặc xác nhận. Đọc thêm tại Điều khoản Sử dụng.