
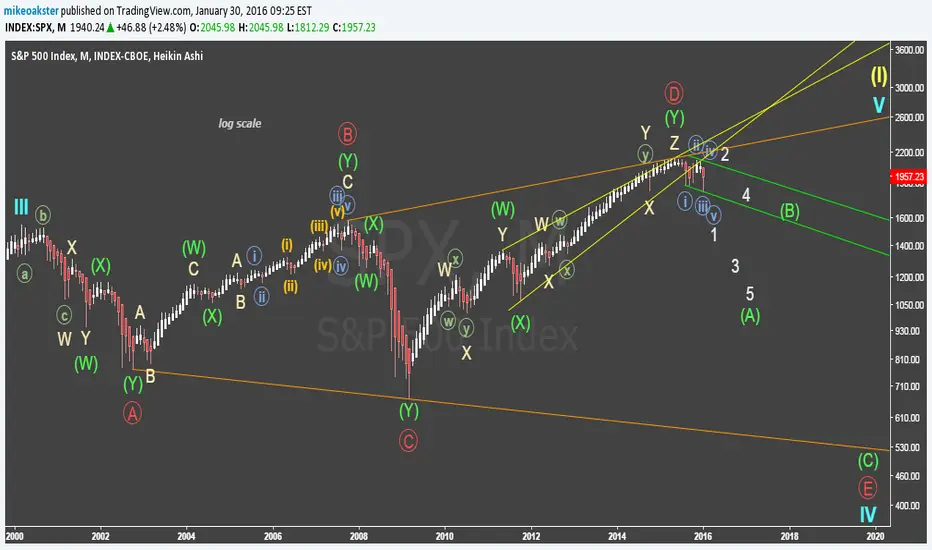
I've just realized that, in the monthly time frame, since March 2000, the only time that bearish price action was verified without being followed by a crash was back in August 2004.
Well, now, January 2016 is the first month since March 2009 which produces bearish price action, and I find it much more similar with the monthly bearish price actions that leaded to the 2000 and 2007 crashes rather than with the one occurred in August 2004...
So, let's see if this month ends up by being one more Intermediate wave X (which would then be followed by a final Intermediate wave Z who knows making a new all time high) or if it is the confirmation of a major crash which would then be probably headed to complete the final Primary E wave of the expanding triangle plotted on the chart.
Well, now, January 2016 is the first month since March 2009 which produces bearish price action, and I find it much more similar with the monthly bearish price actions that leaded to the 2000 and 2007 crashes rather than with the one occurred in August 2004...
So, let's see if this month ends up by being one more Intermediate wave X (which would then be followed by a final Intermediate wave Z who knows making a new all time high) or if it is the confirmation of a major crash which would then be probably headed to complete the final Primary E wave of the expanding triangle plotted on the chart.

Bài đăng liên quan
Thông báo miễn trừ trách nhiệm
Thông tin và các ấn phẩm này không nhằm mục đích, và không cấu thành, lời khuyên hoặc khuyến nghị về tài chính, đầu tư, giao dịch hay các loại khác do TradingView cung cấp hoặc xác nhận. Đọc thêm tại Điều khoản Sử dụng.
Bài đăng liên quan
Thông báo miễn trừ trách nhiệm
Thông tin và các ấn phẩm này không nhằm mục đích, và không cấu thành, lời khuyên hoặc khuyến nghị về tài chính, đầu tư, giao dịch hay các loại khác do TradingView cung cấp hoặc xác nhận. Đọc thêm tại Điều khoản Sử dụng.