
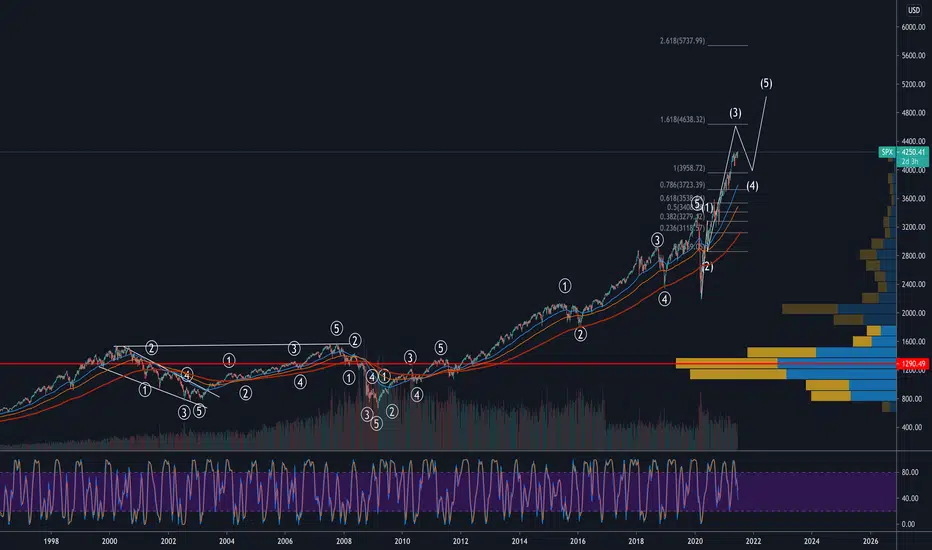
Playing around with this count on the LT weekly chart from b4 2000 dot com bubble. SP500 looks like a very clean 5 up & 5 wave down pattern 1 after another. I am sure that if we dial down into the LTF we could find many complex Flat & zig zag corrections but zoomed out everything looks pretty clean.
The W3 that we are currently in lines up with 4600 rough target. I know a W4 is coming but the fib 1.618 lvl is really a better target for W3. So maybe SP500 continues up for now until 4600 and after that W4 will ensue. Hard to tell but I don't see W4 forming as of yet even with all the bearish inflation narratives.
The W3 that we are currently in lines up with 4600 rough target. I know a W4 is coming but the fib 1.618 lvl is really a better target for W3. So maybe SP500 continues up for now until 4600 and after that W4 will ensue. Hard to tell but I don't see W4 forming as of yet even with all the bearish inflation narratives.

If your interested in joining my group DM me for the link. We do Elliot Wave TA give trade signals and set ups. We have channels for all cryptocurrency and also many OTC stocks. TY
Thông báo miễn trừ trách nhiệm
Thông tin và các ấn phẩm này không nhằm mục đích, và không cấu thành, lời khuyên hoặc khuyến nghị về tài chính, đầu tư, giao dịch hay các loại khác do TradingView cung cấp hoặc xác nhận. Đọc thêm tại Điều khoản Sử dụng.
If your interested in joining my group DM me for the link. We do Elliot Wave TA give trade signals and set ups. We have channels for all cryptocurrency and also many OTC stocks. TY
Thông báo miễn trừ trách nhiệm
Thông tin và các ấn phẩm này không nhằm mục đích, và không cấu thành, lời khuyên hoặc khuyến nghị về tài chính, đầu tư, giao dịch hay các loại khác do TradingView cung cấp hoặc xác nhận. Đọc thêm tại Điều khoản Sử dụng.