
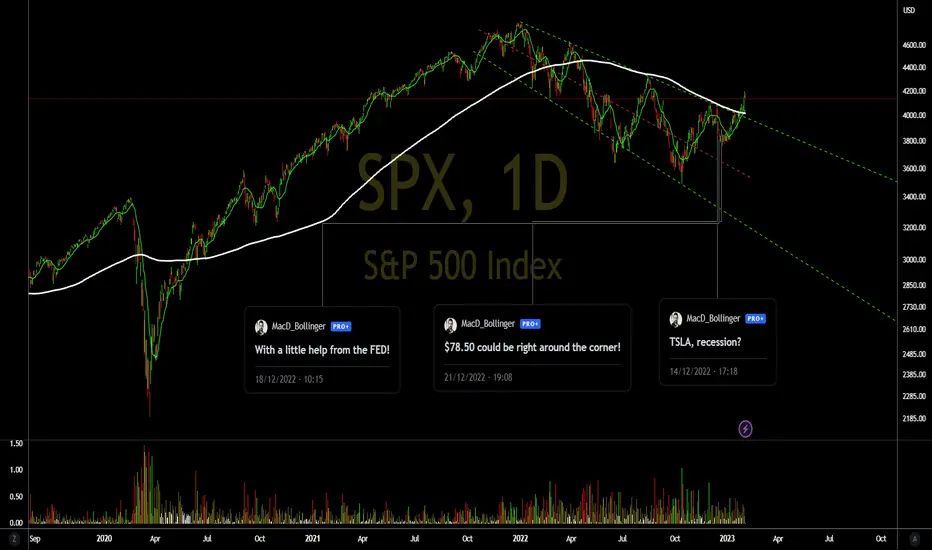
The SPX index is very strange.
-Some indicators are showing improvement, such as the drop in oil prices, which helps to cool down US inflation.
-There is another indicator, the FED, which does not sharply raise the interest rate, just keeping it at current levels, that is, keeping the rate above 4% p.a. throughout 2023.
-We have a bullish pivot formed on the monthly chart, which, given the current circumstances, may want to go further, however, with the release of key companies' balance sheets, it may form a nice buying trap.

-On the weekly chart we also had a bullish pivot forming the correction of the bullish pivot of the monthly chart, in the region of 50% of the FIBO, and this pivot managed to reach the region of 1,618 of FIBO, leaving only one correction until the region of 3900 to continue with strength and seek more accentuated regions.

-Prices have finally broken the major downtrend line and, just below this line, we have the long average, and it could serve as support for prices.

-Can we count on the bulls and see the index rising again and looking for the region of 4400?
-Do your analysis and good business.
-Be Aware, If You Buy, Use Stop!
-See below for other reviews!
-Some indicators are showing improvement, such as the drop in oil prices, which helps to cool down US inflation.
-There is another indicator, the FED, which does not sharply raise the interest rate, just keeping it at current levels, that is, keeping the rate above 4% p.a. throughout 2023.
-We have a bullish pivot formed on the monthly chart, which, given the current circumstances, may want to go further, however, with the release of key companies' balance sheets, it may form a nice buying trap.
-On the weekly chart we also had a bullish pivot forming the correction of the bullish pivot of the monthly chart, in the region of 50% of the FIBO, and this pivot managed to reach the region of 1,618 of FIBO, leaving only one correction until the region of 3900 to continue with strength and seek more accentuated regions.
-Prices have finally broken the major downtrend line and, just below this line, we have the long average, and it could serve as support for prices.
-Can we count on the bulls and see the index rising again and looking for the region of 4400?
-Do your analysis and good business.
-Be Aware, If You Buy, Use Stop!
-See below for other reviews!

Bài đăng liên quan
Thông báo miễn trừ trách nhiệm
Thông tin và các ấn phẩm này không nhằm mục đích, và không cấu thành, lời khuyên hoặc khuyến nghị về tài chính, đầu tư, giao dịch hay các loại khác do TradingView cung cấp hoặc xác nhận. Đọc thêm tại Điều khoản Sử dụng.
Bài đăng liên quan
Thông báo miễn trừ trách nhiệm
Thông tin và các ấn phẩm này không nhằm mục đích, và không cấu thành, lời khuyên hoặc khuyến nghị về tài chính, đầu tư, giao dịch hay các loại khác do TradingView cung cấp hoặc xác nhận. Đọc thêm tại Điều khoản Sử dụng.