
Hello Traders!
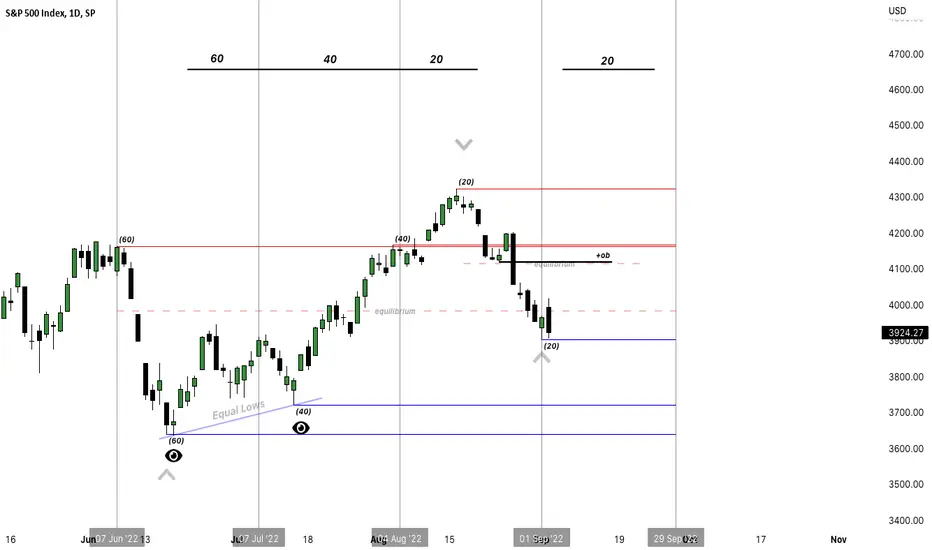
As you can see we have specific highs and lows noted off.
Looking back 20-60 days from the begging of the trading month gives a data pool to speculate.
The 40 day and 60 day lows are relatively equal. I would like to see price seek the sell side liquidity below those lows.
We are currently in two ranges. The largest range is the 60 day low and 20 day high. You can see the arrows and equilibrium line.
The other range is the 20 day high and 20 day low currently. You can also see the equilibrium line for that range.
I would like to see price give buyers false hope of going long again.
That would mean a lower swing high must form then we should anticipate that as commercials increasing net shorts. While retail increases net longs to be trapped.
Ideally getting a sell above equilibrium would be higher probability for the trader looking for a sell model.
As you can see we have specific highs and lows noted off.
Looking back 20-60 days from the begging of the trading month gives a data pool to speculate.
The 40 day and 60 day lows are relatively equal. I would like to see price seek the sell side liquidity below those lows.
We are currently in two ranges. The largest range is the 60 day low and 20 day high. You can see the arrows and equilibrium line.
The other range is the 20 day high and 20 day low currently. You can also see the equilibrium line for that range.
I would like to see price give buyers false hope of going long again.
That would mean a lower swing high must form then we should anticipate that as commercials increasing net shorts. While retail increases net longs to be trapped.
Ideally getting a sell above equilibrium would be higher probability for the trader looking for a sell model.

Thông báo miễn trừ trách nhiệm
Thông tin và các ấn phẩm này không nhằm mục đích, và không cấu thành, lời khuyên hoặc khuyến nghị về tài chính, đầu tư, giao dịch hay các loại khác do TradingView cung cấp hoặc xác nhận. Đọc thêm tại Điều khoản Sử dụng.
Thông báo miễn trừ trách nhiệm
Thông tin và các ấn phẩm này không nhằm mục đích, và không cấu thành, lời khuyên hoặc khuyến nghị về tài chính, đầu tư, giao dịch hay các loại khác do TradingView cung cấp hoặc xác nhận. Đọc thêm tại Điều khoản Sử dụng.