
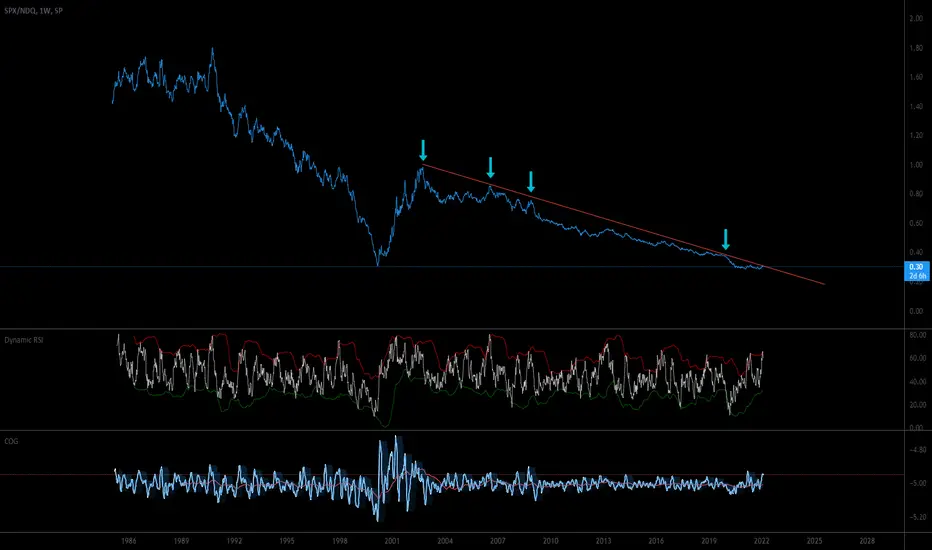
This is a fascinating chart. Since 1985, the NASDAQ 100 Index has been consistently outperforming the S&P 500 except for 2 years following the bursting of the Dot.com Bubble.
Also of note is the well-defined downtrend line that has been tested several times in the past, and is currently being tested again. The ratio is currently near the same level that marked the top of the last tech bubble peak, and is facing pressure from tightening financial conditions.
Watch this chart closely for clues to selecting asset classes that will outperform going forward.
Also of note is the well-defined downtrend line that has been tested several times in the past, and is currently being tested again. The ratio is currently near the same level that marked the top of the last tech bubble peak, and is facing pressure from tightening financial conditions.
Watch this chart closely for clues to selecting asset classes that will outperform going forward.

Thông báo miễn trừ trách nhiệm
Thông tin và các ấn phẩm này không nhằm mục đích, và không cấu thành, lời khuyên hoặc khuyến nghị về tài chính, đầu tư, giao dịch hay các loại khác do TradingView cung cấp hoặc xác nhận. Đọc thêm tại Điều khoản Sử dụng.
Thông báo miễn trừ trách nhiệm
Thông tin và các ấn phẩm này không nhằm mục đích, và không cấu thành, lời khuyên hoặc khuyến nghị về tài chính, đầu tư, giao dịch hay các loại khác do TradingView cung cấp hoặc xác nhận. Đọc thêm tại Điều khoản Sử dụng.