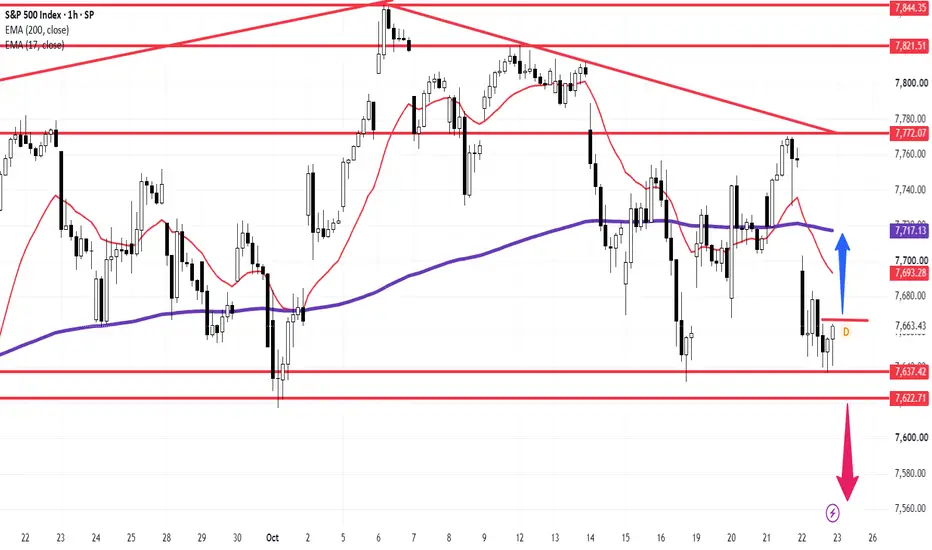
S&P 500 ( SPX) 1h Technical Matrix: Friday Rebound Outlook off 7,663 Support Base Targets 17-EMA (7,693) & 200-EMA (7,717)
### 🇺🇸 S&P 500 ($SPCFD / SPX) 1-Hour Technical Matrix (Ref: SPX_2026-10-23_12-01-00.png)
We are issuing an updated 1-Hour (1h) technical matrix for the S&P 500 Index ($SPCFD) heading into Friday's session. Following a corrective drop that found solid demand absorption around the lower horizontal baseline at 7,637.42, price action is setting up a short-term mean-reversion recovery wave.
The index is currently trading at **7,663.43 (+0.09%)**, holding right along its key static horizontal floor and preparing an intraday rebound effort.
---
### 🔍 Technical Architecture & Level Roadmap:
1. **Immediate Demand Base & Decision Floor:**
* **Static Horizontal Pivot:** **7,663.43** (red horizontal line) — Active support node providing a springboard for the Friday recovery wave.
* **Secondary Structural Floor:** **7,637.42 – 7,622.71** (red horizontal lines) — Key demand zone that must hold to preserve the rebound thesis.
2. **Upside Recovery Pathway (Blue Arrow Scenario):**
* **Immediate Dynamic Resistance (17-EMA):** **7,693.28** (red line) — First intraday obstacle required to confirm momentum expansion.
* **Institutional Dynamic Target (200-EMA):** **7,717.13** (purple line) — Core dynamic objective for the mean-reversion bounce.
* **Upper Structural Ceiling:** **7,772.07** (red horizontal line).
3. **Bearish Continuation Pathway (Red Arrow Scenario):**
* **Breakdown Triggers:** **7,637.42 / 7,622.71** — A loss of these consecutive static floors invalidates the recovery setup, accelerating short momentum toward lower extension targets near **7,560.00**.
---
### 🛡️ Strategic Operational Scenarios:
* **Scenario A — Bullish Mean-Reversion Rebound (Primary Expectation - Blue Arrow):** Holding above **7,663.43** followed by a hourly candle close above the **17-EMA (7,693.28)** confirms buyer absorption, opening a recovery vector toward the **7,717.13 (200-EMA)** institutional demand zone.
* **Scenario B — Bearish Breakdown Extension (Red Arrow):** A decisive hourly close below **7,622.71** breaks the macro support floor, unlocking a downside expansion wave toward **7,560.00**.
### 📊 Tactical Parameters Summary:
* **Current Bias:** Neutral / Intraday Recovery Rebound Setup
* **Execution Price:** 7,663.43
* **Immediate Dynamic Resistance (17-EMA):** 7,693.28
* **Institutional Dynamic Target (200-EMA):** 7,717.13
* **Critical Support Base:** 7,637.42 / 7,622.71
* **Macro Downside Extension:** 7,560.00
---
📊 **ChartPro Data**
*US Equity Index Architecture, Multi-Timeframe Dynamic Averages & Systematic Risk Control.*
⚠️ **Disclaimer:** Educational study only. Not financial advice. Maintain disciplined position sizing and strict risk management protocols.
SPX) 1h Technical Matrix: Friday Rebound Outlook off 7,663 Support Base Targets 17-EMA (7,693) & 200-EMA (7,717)### 🇺🇸 S&P 500 ($SPCFD / SPX) 1-Hour Technical Matrix (Ref: SPX_2026-10-23_12-01-00.png)
We are issuing an updated 1-Hour (1h) technical matrix for the S&P 500 Index ($SPCFD) heading into Friday's session. Following a corrective drop that found solid demand absorption around the lower horizontal baseline at 7,637.42, price action is setting up a short-term mean-reversion recovery wave.
The index is currently trading at **7,663.43 (+0.09%)**, holding right along its key static horizontal floor and preparing an intraday rebound effort.
---
### 🔍 Technical Architecture & Level Roadmap:
1. **Immediate Demand Base & Decision Floor:**
* **Static Horizontal Pivot:** **7,663.43** (red horizontal line) — Active support node providing a springboard for the Friday recovery wave.
* **Secondary Structural Floor:** **7,637.42 – 7,622.71** (red horizontal lines) — Key demand zone that must hold to preserve the rebound thesis.
2. **Upside Recovery Pathway (Blue Arrow Scenario):**
* **Immediate Dynamic Resistance (17-EMA):** **7,693.28** (red line) — First intraday obstacle required to confirm momentum expansion.
* **Institutional Dynamic Target (200-EMA):** **7,717.13** (purple line) — Core dynamic objective for the mean-reversion bounce.
* **Upper Structural Ceiling:** **7,772.07** (red horizontal line).
3. **Bearish Continuation Pathway (Red Arrow Scenario):**
* **Breakdown Triggers:** **7,637.42 / 7,622.71** — A loss of these consecutive static floors invalidates the recovery setup, accelerating short momentum toward lower extension targets near **7,560.00**.
---
### 🛡️ Strategic Operational Scenarios:
* **Scenario A — Bullish Mean-Reversion Rebound (Primary Expectation - Blue Arrow):** Holding above **7,663.43** followed by a hourly candle close above the **17-EMA (7,693.28)** confirms buyer absorption, opening a recovery vector toward the **7,717.13 (200-EMA)** institutional demand zone.
* **Scenario B — Bearish Breakdown Extension (Red Arrow):** A decisive hourly close below **7,622.71** breaks the macro support floor, unlocking a downside expansion wave toward **7,560.00**.
### 📊 Tactical Parameters Summary:
* **Current Bias:** Neutral / Intraday Recovery Rebound Setup
* **Execution Price:** 7,663.43
* **Immediate Dynamic Resistance (17-EMA):** 7,693.28
* **Institutional Dynamic Target (200-EMA):** 7,717.13
* **Critical Support Base:** 7,637.42 / 7,622.71
* **Macro Downside Extension:** 7,560.00
---
📊 **ChartPro Data**
*US Equity Index Architecture, Multi-Timeframe Dynamic Averages & Systematic Risk Control.*
⚠️ **Disclaimer:** Educational study only. Not financial advice. Maintain disciplined position sizing and strict risk management protocols.

Thông báo miễn trừ trách nhiệm
Thông tin và các ấn phẩm này không nhằm mục đích, và không cấu thành, lời khuyên hoặc khuyến nghị về tài chính, đầu tư, giao dịch hay các loại khác do TradingView cung cấp hoặc xác nhận. Đọc thêm tại Điều khoản Sử dụng.
Thông báo miễn trừ trách nhiệm
Thông tin và các ấn phẩm này không nhằm mục đích, và không cấu thành, lời khuyên hoặc khuyến nghị về tài chính, đầu tư, giao dịch hay các loại khác do TradingView cung cấp hoặc xác nhận. Đọc thêm tại Điều khoản Sử dụng.