
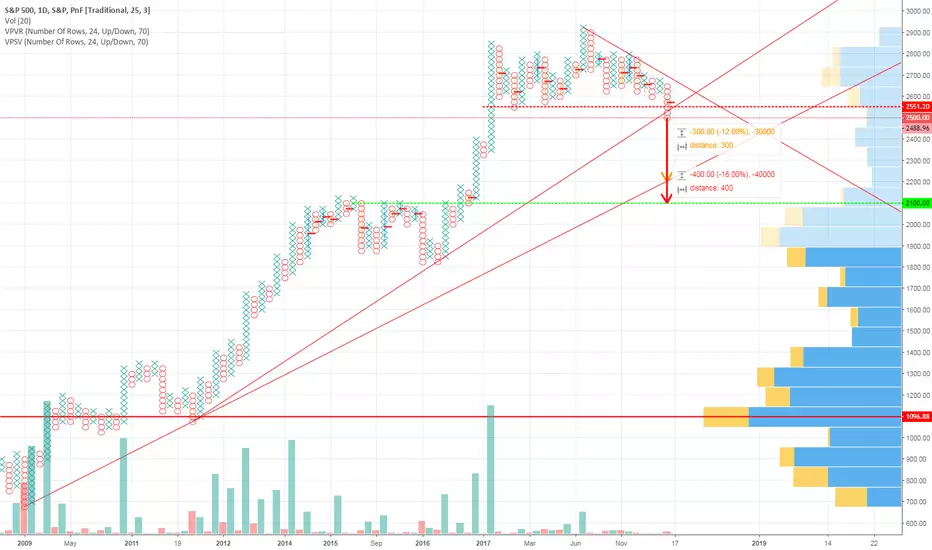
This is a corrective/bearish outlook on S&P500 Index based on Point & Figure charting.
The Index managed to breach below the first uptrend line around the 2,550 level. Based on P&F charting (which is, arguably, one of the oldest charting techniques used in the western hemisphere), I expect the Index to dip to the second major uptrend line @ 2,200 points (-12% from 2,500 level) as a first target. My second expected target is around the peak of the first consolidation seen on the chart @ 2,100 points (-16% from 2,500). The third expected target, albeit far-fetched but remains a possibility, has been derived from the horizontal-counting and not shown on the chart, is 1,750 points (-30% from 2,500) points.
It should be noted that the P&F chart used has been setup as 25x3
*Always remember; this is an opinion, not a recommendation*

Thông báo miễn trừ trách nhiệm
Thông tin và các ấn phẩm này không nhằm mục đích, và không cấu thành, lời khuyên hoặc khuyến nghị về tài chính, đầu tư, giao dịch hay các loại khác do TradingView cung cấp hoặc xác nhận. Đọc thêm tại Điều khoản Sử dụng.
Thông báo miễn trừ trách nhiệm
Thông tin và các ấn phẩm này không nhằm mục đích, và không cấu thành, lời khuyên hoặc khuyến nghị về tài chính, đầu tư, giao dịch hay các loại khác do TradingView cung cấp hoặc xác nhận. Đọc thêm tại Điều khoản Sử dụng.