
Hello traders and investors! Let’s see how the SPX is doing today!
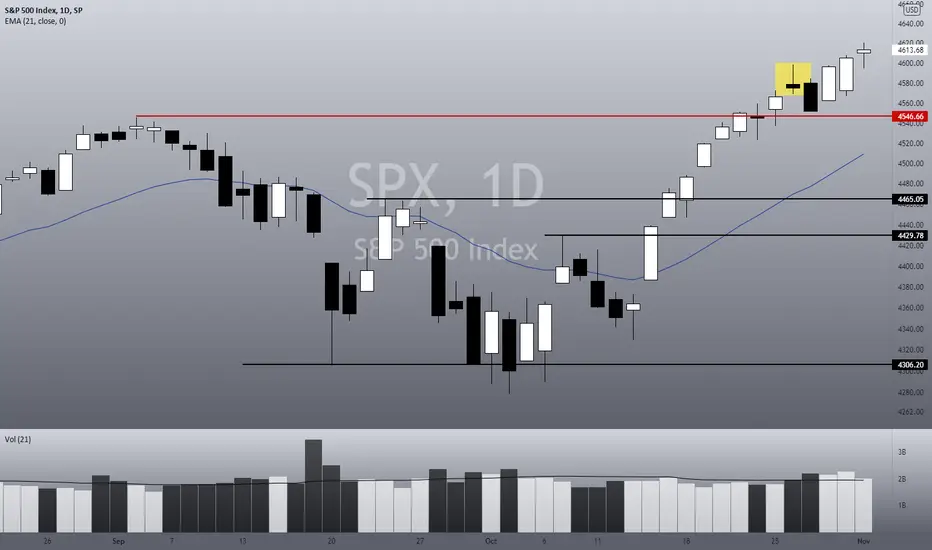
It seems we see a bearish sign on the SPX, indicating a possible top (spinning top?), but I wouldn’t be too excited about it. After all, the index already did a similar pattern last Tuesday (it even more bearish, as it was a shooting star), and it was just a bear trap, as we thought.
What’s more, it is always important to analyze the hourly chart before any conclusion.

In the 1h chart, we don’t see any bearish structure yet, and we only see a healthy bull trend. As long as the index keeps doing higher highs/lows, the trend won’t reverse.
As stated by the 1st tenet of the Dow Theory: Trends persist until a clear reversal occurs. So far, I see no clear reversal. We have two support levels to keep our eyes on: The 21 ema, and the 4,567. If the index loses both supports, probably we’ll see some pullback in the daily chart.
For now, let’s just follow it closely, and if you liked this analysis, remember to follow me to keep in touch with my daily updates on stocks and indices. Also, support this idea if it helped you!
Have a good day.
It seems we see a bearish sign on the SPX, indicating a possible top (spinning top?), but I wouldn’t be too excited about it. After all, the index already did a similar pattern last Tuesday (it even more bearish, as it was a shooting star), and it was just a bear trap, as we thought.
What’s more, it is always important to analyze the hourly chart before any conclusion.
In the 1h chart, we don’t see any bearish structure yet, and we only see a healthy bull trend. As long as the index keeps doing higher highs/lows, the trend won’t reverse.
As stated by the 1st tenet of the Dow Theory: Trends persist until a clear reversal occurs. So far, I see no clear reversal. We have two support levels to keep our eyes on: The 21 ema, and the 4,567. If the index loses both supports, probably we’ll see some pullback in the daily chart.
For now, let’s just follow it closely, and if you liked this analysis, remember to follow me to keep in touch with my daily updates on stocks and indices. Also, support this idea if it helped you!
Have a good day.

Bài đăng liên quan
Thông báo miễn trừ trách nhiệm
Thông tin và các ấn phẩm này không nhằm mục đích, và không cấu thành, lời khuyên hoặc khuyến nghị về tài chính, đầu tư, giao dịch hay các loại khác do TradingView cung cấp hoặc xác nhận. Đọc thêm tại Điều khoản Sử dụng.
Thông báo miễn trừ trách nhiệm
Thông tin và các ấn phẩm này không nhằm mục đích, và không cấu thành, lời khuyên hoặc khuyến nghị về tài chính, đầu tư, giao dịch hay các loại khác do TradingView cung cấp hoặc xác nhận. Đọc thêm tại Điều khoản Sử dụng.