
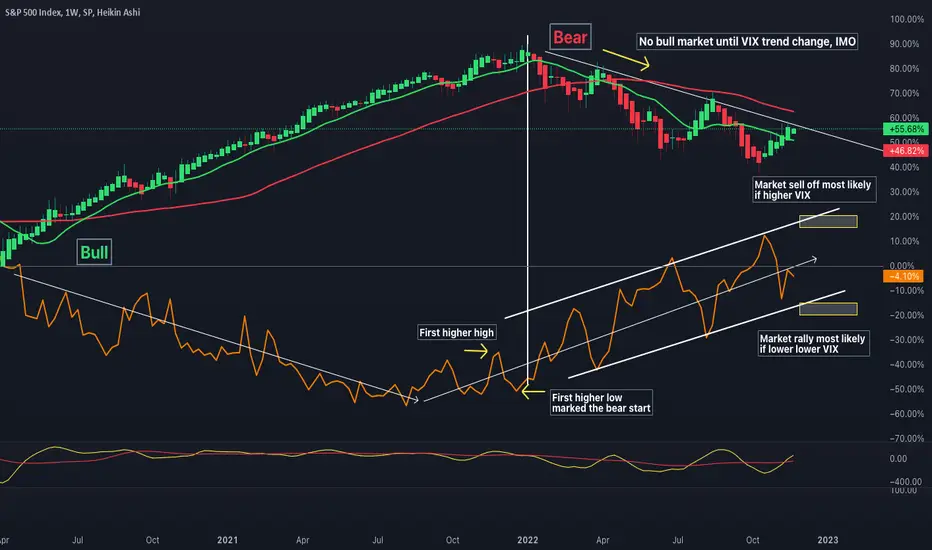
S&P chart against VIX on the monthly time frame.
Comparing the longer term trends, when the VIX cycles up and down we get rally's and corrections, but if theres a sustained VIX trend change, it could indicate overall market direction change.
IMPORTANT
-Normally indicated by higher highs/lows and lower highs/lows on VIX channel.
None of this should be interpreted as financial advice, I am not a professional or certified financial adviser! all charts, and or analysis' are my personal opinions and observations only!
Comparing the longer term trends, when the VIX cycles up and down we get rally's and corrections, but if theres a sustained VIX trend change, it could indicate overall market direction change.
IMPORTANT
-Normally indicated by higher highs/lows and lower highs/lows on VIX channel.
None of this should be interpreted as financial advice, I am not a professional or certified financial adviser! all charts, and or analysis' are my personal opinions and observations only!

Thông báo miễn trừ trách nhiệm
Thông tin và các ấn phẩm này không nhằm mục đích, và không cấu thành, lời khuyên hoặc khuyến nghị về tài chính, đầu tư, giao dịch hay các loại khác do TradingView cung cấp hoặc xác nhận. Đọc thêm tại Điều khoản Sử dụng.
Thông báo miễn trừ trách nhiệm
Thông tin và các ấn phẩm này không nhằm mục đích, và không cấu thành, lời khuyên hoặc khuyến nghị về tài chính, đầu tư, giao dịch hay các loại khác do TradingView cung cấp hoặc xác nhận. Đọc thêm tại Điều khoản Sử dụng.