
Hello, traders 🌴☀️
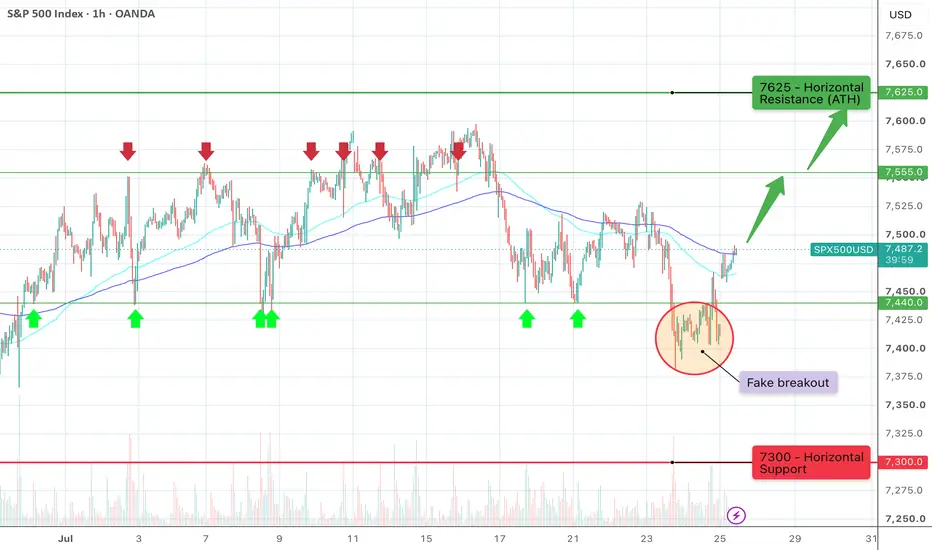
🔪🦬⚰️Last week wasn’t the most pleasant one for the bulls. Negative news gave the bears exactly what they needed to trigger the bearish scenario. As expected, that led to an acceleration toward the 7,300 area. We saw an impulsive break below the 4H EMA 200 (7,470), followed by a breakdown of 7,440, before the S&P 500 printed a local low of 7,382 on Thursday.
🧠 Today’s chart, however, looks very interesting.
After breaking well below 7,440, the index is now back above that level with a massive gap higher 🚀, trapping a large number of traders who were betting on a continuation of the sell-off.
The market rarely gives such a large group of traders a chance to exit their positions at breakeven after a false breakdown like this.
🦬🚀With so many shorts now trapped below 7,440, my primary scenario is a continuation toward 7,555 right from the start of the U.S. session, followed by a strong acceleration toward the all-time high at 7,625.
🐻🔪That said, the downside levels remain unchanged. If the 4H EMA 200 (7,480) is broken again 7,440 could become the next key support before a potential move lower toward:
- 7,380 — Swing low
- 7,300 — Local horizontal support
- 7,200 — Area of the 1D EMA 100
- 7,000 — Previous all-time high
Peace 🌄
⚠️ Disclaimer:
All information shared on this channel is for educational and informational purposes only and is not investment advice. The author is not responsible for your trading decisions. Always manage your risks and make decisions independently.
🔪🦬⚰️Last week wasn’t the most pleasant one for the bulls. Negative news gave the bears exactly what they needed to trigger the bearish scenario. As expected, that led to an acceleration toward the 7,300 area. We saw an impulsive break below the 4H EMA 200 (7,470), followed by a breakdown of 7,440, before the S&P 500 printed a local low of 7,382 on Thursday.
🧠 Today’s chart, however, looks very interesting.
After breaking well below 7,440, the index is now back above that level with a massive gap higher 🚀, trapping a large number of traders who were betting on a continuation of the sell-off.
The market rarely gives such a large group of traders a chance to exit their positions at breakeven after a false breakdown like this.
🦬🚀With so many shorts now trapped below 7,440, my primary scenario is a continuation toward 7,555 right from the start of the U.S. session, followed by a strong acceleration toward the all-time high at 7,625.
🐻🔪That said, the downside levels remain unchanged. If the 4H EMA 200 (7,480) is broken again 7,440 could become the next key support before a potential move lower toward:
- 7,380 — Swing low
- 7,300 — Local horizontal support
- 7,200 — Area of the 1D EMA 100
- 7,000 — Previous all-time high
Peace 🌄
⚠️ Disclaimer:
All information shared on this channel is for educational and informational purposes only and is not investment advice. The author is not responsible for your trading decisions. Always manage your risks and make decisions independently.

Thông báo miễn trừ trách nhiệm
Thông tin và các ấn phẩm này không nhằm mục đích, và không cấu thành, lời khuyên hoặc khuyến nghị về tài chính, đầu tư, giao dịch hay các loại khác do TradingView cung cấp hoặc xác nhận. Đọc thêm tại Điều khoản Sử dụng.
Thông báo miễn trừ trách nhiệm
Thông tin và các ấn phẩm này không nhằm mục đích, và không cấu thành, lời khuyên hoặc khuyến nghị về tài chính, đầu tư, giao dịch hay các loại khác do TradingView cung cấp hoặc xác nhận. Đọc thêm tại Điều khoản Sử dụng.