
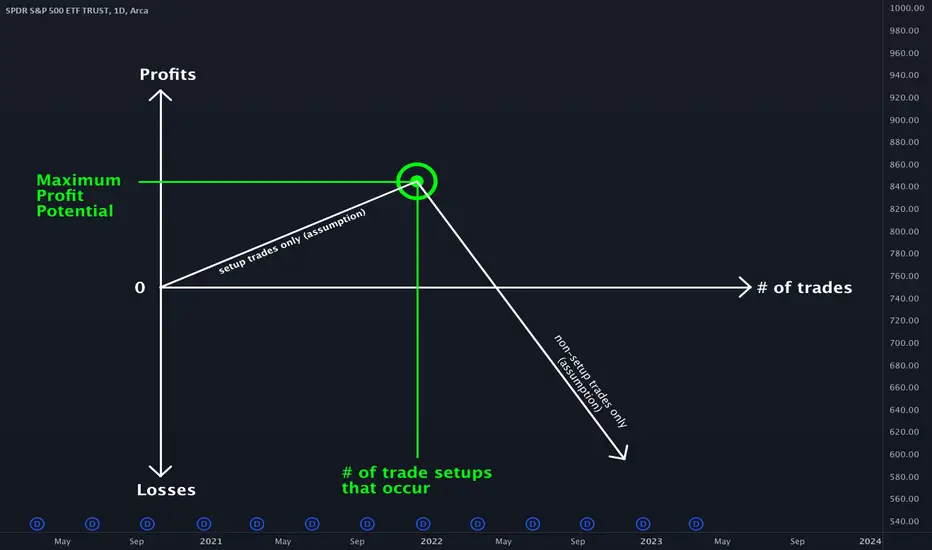
This diagram helps visualize the effects of overtrading. Overtrading is placing more trades than should be placed, typically resulting in unnecessary losses. There is a fixed number of trade setups that will occur with any trading system during any time period and ideally each trade setup will be traded to produce maximal profits. In general, trades that are not setups will result in losses.
For simplicity, this diagram assumes the initial trades placed are all trade setups and that all trades placed beyond the # of trade setups are not setups.
In reality, someone could place a number of trades that corresponds to the # of trade setups, but if half their trades were not setups, they will have losses. The resulting diagram may look something like this:

Bottom line: Trade setups only and try and identify as many setups as you can. Identifying 100% of all setups that exist may be a tall order but trading 100% setups is possible with patience and discipline.
Note: This idea was published primarily with day trading in mind, but it applies to any type of trading.
Screenshot of main diagram:

For simplicity, this diagram assumes the initial trades placed are all trade setups and that all trades placed beyond the # of trade setups are not setups.
In reality, someone could place a number of trades that corresponds to the # of trade setups, but if half their trades were not setups, they will have losses. The resulting diagram may look something like this:
Bottom line: Trade setups only and try and identify as many setups as you can. Identifying 100% of all setups that exist may be a tall order but trading 100% setups is possible with patience and discipline.
Note: This idea was published primarily with day trading in mind, but it applies to any type of trading.
Screenshot of main diagram:

Thông báo miễn trừ trách nhiệm
Thông tin và các ấn phẩm này không nhằm mục đích, và không cấu thành, lời khuyên hoặc khuyến nghị về tài chính, đầu tư, giao dịch hay các loại khác do TradingView cung cấp hoặc xác nhận. Đọc thêm tại Điều khoản Sử dụng.
Thông báo miễn trừ trách nhiệm
Thông tin và các ấn phẩm này không nhằm mục đích, và không cấu thành, lời khuyên hoặc khuyến nghị về tài chính, đầu tư, giao dịch hay các loại khác do TradingView cung cấp hoặc xác nhận. Đọc thêm tại Điều khoản Sử dụng.