Hello, traders! 👋 Welcome to another technical analysis. Today, we're taking a closer look at SPY.

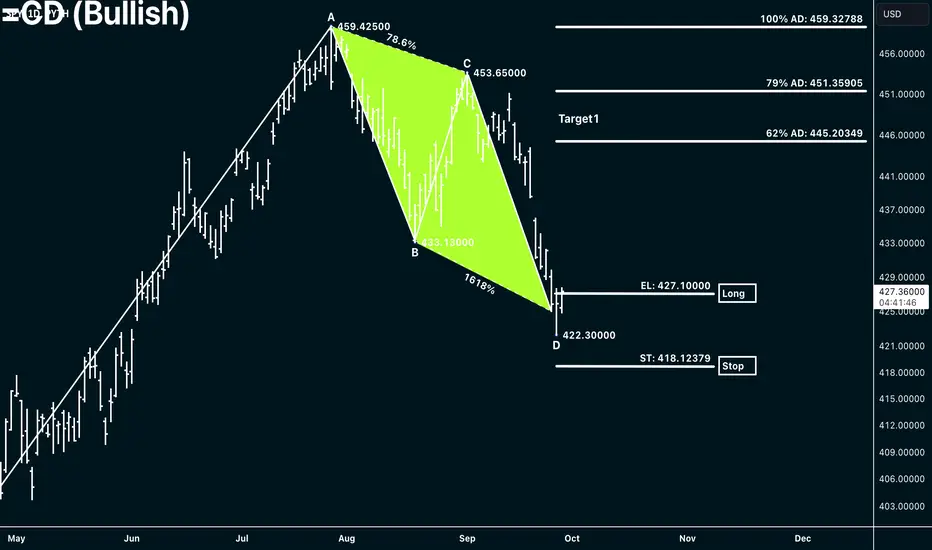
The chart illustrates a symmetry AB=CD pattern, which appears to be bullish on its daily chart. The price has reached an important support level at "D" 422.30000.
The strategy is straightforward: we will buy above the entry level (EL) at 427.10000 with a confirmed upward trend. Our stop-loss will be placed below the cluster zones at ST: 418.12379.
Our target levels will be as follows:
First target at 62% of AD: 445.20349- 79% of AD: 451.35905
Second target at 127% of AD: 469.70833-162% of AD: 482.52695
If you find this analysis interesting and useful, please show your support by liking and following. Stay tuned for more analyses like this one!
The chart illustrates a symmetry AB=CD pattern, which appears to be bullish on its daily chart. The price has reached an important support level at "D" 422.30000.
The strategy is straightforward: we will buy above the entry level (EL) at 427.10000 with a confirmed upward trend. Our stop-loss will be placed below the cluster zones at ST: 418.12379.
Our target levels will be as follows:
First target at 62% of AD: 445.20349- 79% of AD: 451.35905
Second target at 127% of AD: 469.70833-162% of AD: 482.52695
If you find this analysis interesting and useful, please show your support by liking and following. Stay tuned for more analyses like this one!
Ghi chú

Thông báo miễn trừ trách nhiệm
Thông tin và các ấn phẩm này không nhằm mục đích, và không cấu thành, lời khuyên hoặc khuyến nghị về tài chính, đầu tư, giao dịch hay các loại khác do TradingView cung cấp hoặc xác nhận. Đọc thêm tại Điều khoản Sử dụng.
Thông báo miễn trừ trách nhiệm
Thông tin và các ấn phẩm này không nhằm mục đích, và không cấu thành, lời khuyên hoặc khuyến nghị về tài chính, đầu tư, giao dịch hay các loại khác do TradingView cung cấp hoặc xác nhận. Đọc thêm tại Điều khoản Sử dụng.