
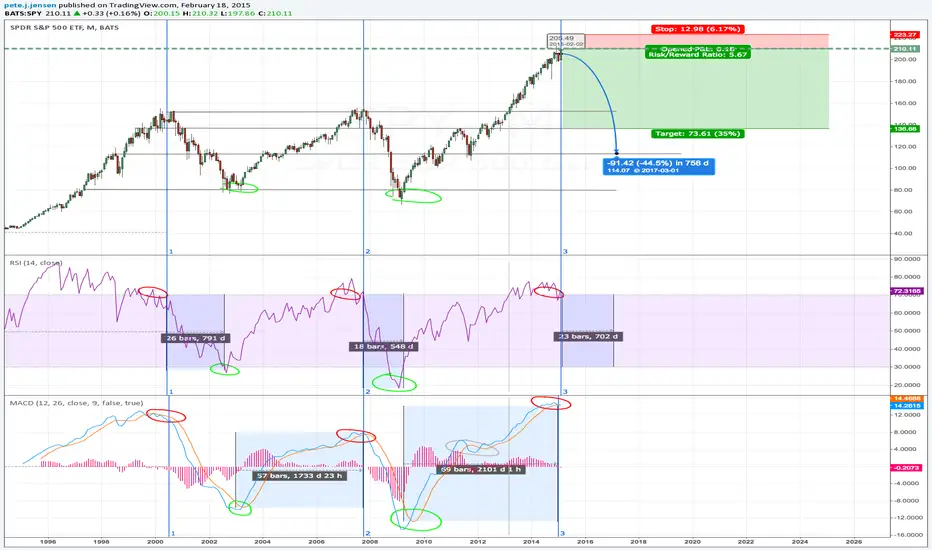
The stars are aligning for a pretty serious pullback in the US Equities Market.
The chart uses my two favorite indicators; RSI and MACD.
I've gone through and marked historical correlations on the chart for prior crashes for both indicators.
RSI going above 70; signals overvalued
RSI going below 30; signals underbought
MACD Converging (Red)
MACD Diverging (Green)
You'll see both of these correlate quite nicely with the two previous crashes.
**Projections**
I project a between a 30-40 percent pull back spanning nearly two years.
I've added a possible short position with a fairly tight tolerance for a good ratio.
I'll keep the chart updated in case we're looking at a false-top; given present valuations and P/E ratios I don't think we are.
The chart uses my two favorite indicators; RSI and MACD.
I've gone through and marked historical correlations on the chart for prior crashes for both indicators.
RSI going above 70; signals overvalued
RSI going below 30; signals underbought
MACD Converging (Red)
MACD Diverging (Green)
You'll see both of these correlate quite nicely with the two previous crashes.
**Projections**
I project a between a 30-40 percent pull back spanning nearly two years.
I've added a possible short position with a fairly tight tolerance for a good ratio.
I'll keep the chart updated in case we're looking at a false-top; given present valuations and P/E ratios I don't think we are.

Thông báo miễn trừ trách nhiệm
Thông tin và các ấn phẩm này không nhằm mục đích, và không cấu thành, lời khuyên hoặc khuyến nghị về tài chính, đầu tư, giao dịch hay các loại khác do TradingView cung cấp hoặc xác nhận. Đọc thêm tại Điều khoản Sử dụng.
Thông báo miễn trừ trách nhiệm
Thông tin và các ấn phẩm này không nhằm mục đích, và không cấu thành, lời khuyên hoặc khuyến nghị về tài chính, đầu tư, giao dịch hay các loại khác do TradingView cung cấp hoặc xác nhận. Đọc thêm tại Điều khoản Sử dụng.