
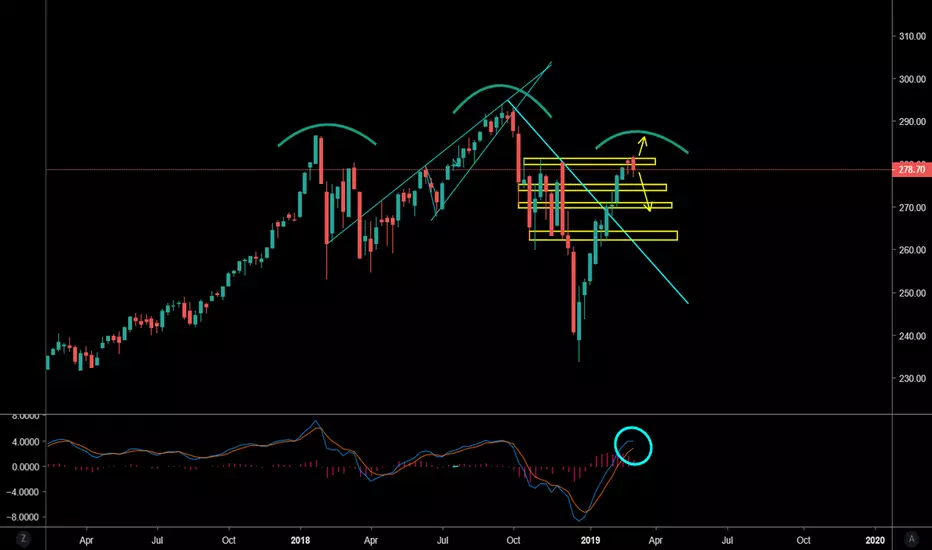
I have posted an IWM chart not too long ago but from the daily chart perspective. Here we have a SPY weekly chart with some areas to keep on watch. We have finally come into an area of strong resistance and finally some red juicy candles. Now of course resistance can be broken to the upside and we do have a trade deal on the horizon in which trump tweets an update every weekend about. On the larger picture we have a head and shoulders topping pattern which could lead to some bad turbulence in the coming weeks. So just keep watch for the yellow boxed levels and be safe in the coming weeks. Also keep watch on IWM as it was the first to go last year before SPY, also watch Gold as it has had a pullback for a couple days and could be ready for another leg higher. Weed stocks also tend to move when the markets become shaky and if you'd like, I have some charts for the weed players in which today alone made me more than I make a month of working for a bank. Goodnight everyone. Cheers!

Thông báo miễn trừ trách nhiệm
Thông tin và các ấn phẩm này không nhằm mục đích, và không cấu thành, lời khuyên hoặc khuyến nghị về tài chính, đầu tư, giao dịch hay các loại khác do TradingView cung cấp hoặc xác nhận. Đọc thêm tại Điều khoản Sử dụng.
Thông báo miễn trừ trách nhiệm
Thông tin và các ấn phẩm này không nhằm mục đích, và không cấu thành, lời khuyên hoặc khuyến nghị về tài chính, đầu tư, giao dịch hay các loại khác do TradingView cung cấp hoặc xác nhận. Đọc thêm tại Điều khoản Sử dụng.