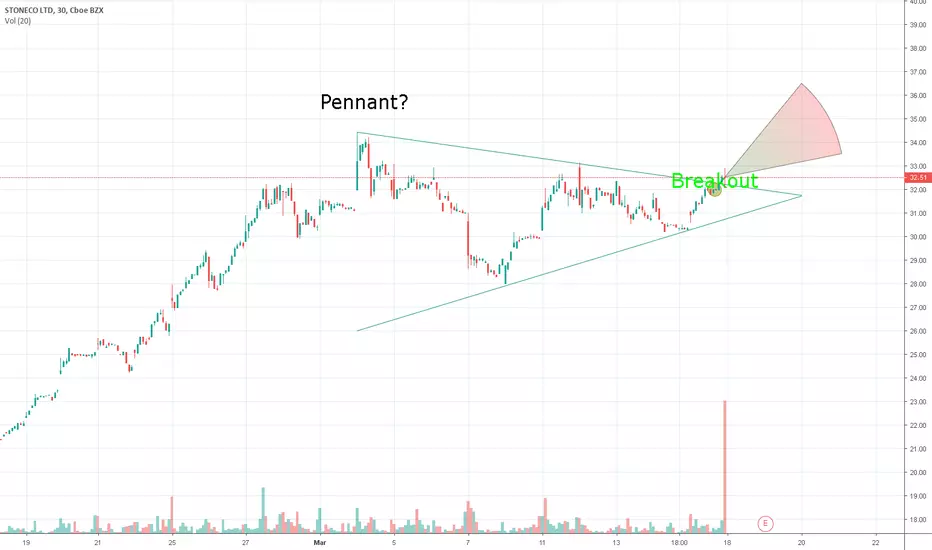
 STNE This is my first time doing chart patterns, but I think I am on to something here. We all know that STNE is a good long stock, but due to the recent bottom, it has been even more of a buy. If we look at the chart provided below, we can see that it almost fits the Pennant chart pattern. Im thinking once earnings comes, its gonna skyrocket all the way to $36.50, and then come down a bit due to people taking profits. Again this isn't really comprehensive and its my first time doing something like this so please take it with a grain of salt. Thank you.
Ghi chú
Sorry, the predicted pattern on the chart doesn't reflect what I am saying, instead, look at the chart in the comments.
Thông báo miễn trừ trách nhiệm
Thông tin và các ấn phẩm này không nhằm mục đích, và không cấu thành, lời khuyên hoặc khuyến nghị về tài chính, đầu tư, giao dịch hay các loại khác do TradingView cung cấp hoặc xác nhận. Đọc thêm tại Điều khoản Sử dụng.
Thông báo miễn trừ trách nhiệm
Thông tin và các ấn phẩm này không nhằm mục đích, và không cấu thành, lời khuyên hoặc khuyến nghị về tài chính, đầu tư, giao dịch hay các loại khác do TradingView cung cấp hoặc xác nhận. Đọc thêm tại Điều khoản Sử dụng.