
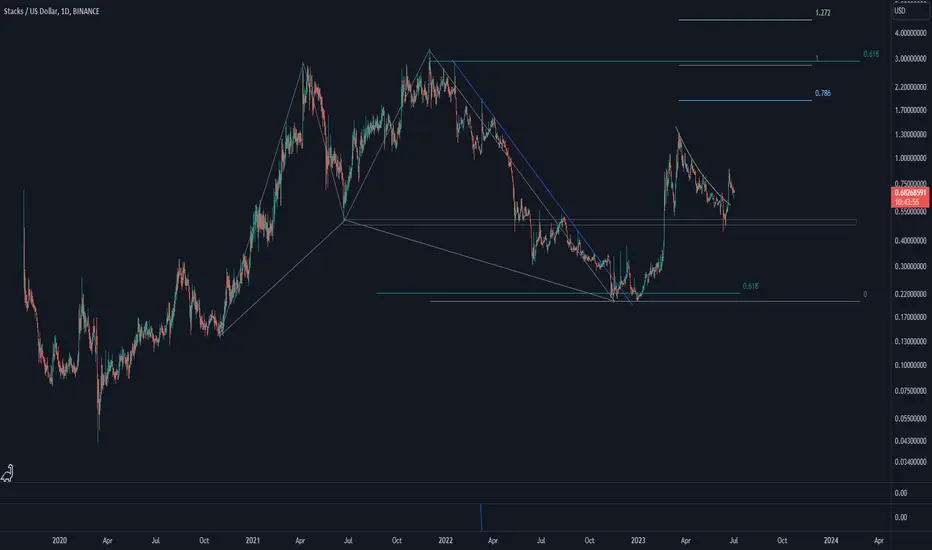
Stacks started its upward impulse wave sooner than others. Back when a harmonic pattern ended and price settled on 0.618 Fibonacci level, STX started a strong upward wave. After a 500% growth, corrective wave started. Now it seems STX posed for continuation. Let's see what happens.
Ghi chú
STX is breaking the second curved downtrend line. Let's see how up it can go.
Ghi chú
STX broke the descending triangle correction pattern is going up.
Ghi chú
STX broke the major downtrend line, and broke it with momentum. This behavior could be sign of powerful upward impulse wave indicating that STX could see much higher price. Let's see what happens.
Ghi chú
After STX broke the major downtrend line, it went up, and still going. Now, STX is approaching the intersection of the major horizontal area and the possible ascending channel's upper line. Let's see how STX reacts to these areas.
Ghi chú
So, STX went up very well and reached both the ascending channel's upper line and major horizontal resistance area. Unless important news about STX cause to burst through this area upward, correction is most likely to happen. Let's see what happens.
Ghi chú
So, correction brought STX down to the channel's middle line. Let's see if STX's correction ends here and an upward move starts or not.
Ghi chú
So, STX went down to the channel's lower line. Recently, STX broke the downtrend line, and it seems ready for the next upward phase. Let's see what happens.

Thông báo miễn trừ trách nhiệm
Thông tin và các ấn phẩm này không nhằm mục đích, và không cấu thành, lời khuyên hoặc khuyến nghị về tài chính, đầu tư, giao dịch hay các loại khác do TradingView cung cấp hoặc xác nhận. Đọc thêm tại Điều khoản Sử dụng.
Thông báo miễn trừ trách nhiệm
Thông tin và các ấn phẩm này không nhằm mục đích, và không cấu thành, lời khuyên hoặc khuyến nghị về tài chính, đầu tư, giao dịch hay các loại khác do TradingView cung cấp hoặc xác nhận. Đọc thêm tại Điều khoản Sử dụng.