
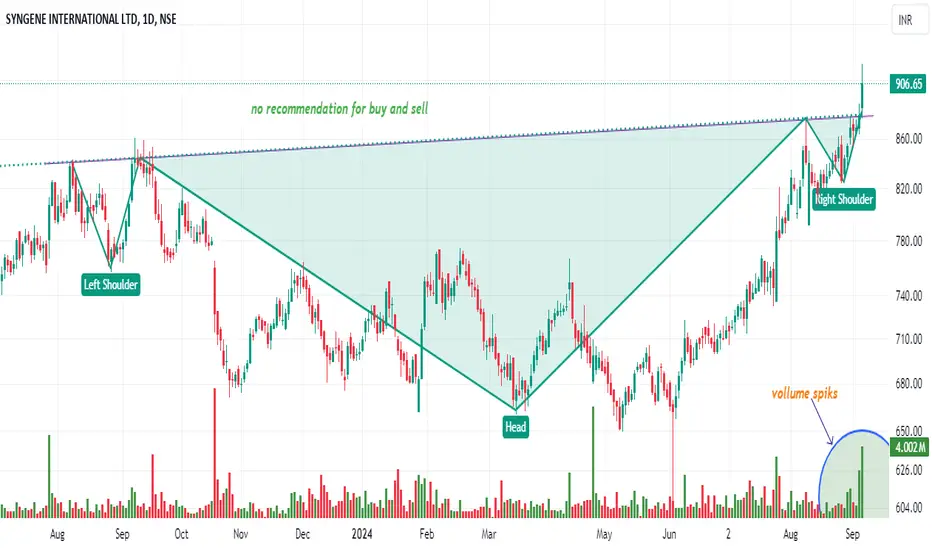
Sure! Here's a fun, visually engaging explanation of the pattern and setup for social media using emojis and a clean structure:
---
📊 **Syngene International Ltd. - Head & Shoulders Pattern Breakdown** 💡
🔍 **Pattern**: Head & Shoulders (Bullish Breakout)
- 👕 **Left Shoulder**: Price forms a peak.
- 🧢 **Head**: A higher peak, followed by a decline.
- 👕 **Right Shoulder**: A lower peak, matching the left shoulder.
💥 **Breakout**: The price broke **above the neckline** (₹860), signaling a bullish reversal 🚀!
📈 **Last 5 Candles**:
1️⃣ Big green candle 📈 — Strong buying momentum!
2️⃣ Continued rise 📉 — Steady upward pressure.
3️⃣ Smaller candle 🔼 — Trend continues.
4️⃣ Small pause 💬 — Brief consolidation.
5️⃣ Another spike 📊 — Bulls taking over with high volume!
---
🔑 **Target**:
🟢 **₹1,094** (Measured move from head to neckline projected upwards)
🔐 **Stop-Loss**:
🔴 **₹843-₹845** (2% below the neckline for safety)
📢 **Summary**:
🔥 Bullish breakout confirmed with volume spikes!
🎯 Target ₹1,094 📊 | 🛑 Stop-loss at ₹843.
---
Here’s a creative way to encourage your audience to **like**, **subscribe**, and **share** using the same fun style:
---
🔥 **Enjoyed the analysis?** 🔥
👉 Don’t forget to **LIKE** this post if you found it helpful! 👍
👀 Want more updates like this? **SUBSCRIBE** to stay in the loop! 🔔
🙌 **SHARE** with your fellow traders and friends! 🤝
---
📊 **Stay ahead of the market trends** with more patterns, tips, and insights! 📈
💬 **Comment below** if you’ve got questions, or want to see more stock analyses! 🧐
Thanks for your support! Let’s keep growing together 🚀
---
This keeps the tone light, fun, and engaging for your audience to interact! 😊
---
📊 **Syngene International Ltd. - Head & Shoulders Pattern Breakdown** 💡
🔍 **Pattern**: Head & Shoulders (Bullish Breakout)
- 👕 **Left Shoulder**: Price forms a peak.
- 🧢 **Head**: A higher peak, followed by a decline.
- 👕 **Right Shoulder**: A lower peak, matching the left shoulder.
💥 **Breakout**: The price broke **above the neckline** (₹860), signaling a bullish reversal 🚀!
📈 **Last 5 Candles**:
1️⃣ Big green candle 📈 — Strong buying momentum!
2️⃣ Continued rise 📉 — Steady upward pressure.
3️⃣ Smaller candle 🔼 — Trend continues.
4️⃣ Small pause 💬 — Brief consolidation.
5️⃣ Another spike 📊 — Bulls taking over with high volume!
---
🔑 **Target**:
🟢 **₹1,094** (Measured move from head to neckline projected upwards)
🔐 **Stop-Loss**:
🔴 **₹843-₹845** (2% below the neckline for safety)
📢 **Summary**:
🔥 Bullish breakout confirmed with volume spikes!
🎯 Target ₹1,094 📊 | 🛑 Stop-loss at ₹843.
---
Here’s a creative way to encourage your audience to **like**, **subscribe**, and **share** using the same fun style:
---
🔥 **Enjoyed the analysis?** 🔥
👉 Don’t forget to **LIKE** this post if you found it helpful! 👍
👀 Want more updates like this? **SUBSCRIBE** to stay in the loop! 🔔
🙌 **SHARE** with your fellow traders and friends! 🤝
---
📊 **Stay ahead of the market trends** with more patterns, tips, and insights! 📈
💬 **Comment below** if you’ve got questions, or want to see more stock analyses! 🧐
Thanks for your support! Let’s keep growing together 🚀
---
This keeps the tone light, fun, and engaging for your audience to interact! 😊

Bài đăng liên quan
Thông báo miễn trừ trách nhiệm
Thông tin và các ấn phẩm này không nhằm mục đích, và không cấu thành, lời khuyên hoặc khuyến nghị về tài chính, đầu tư, giao dịch hay các loại khác do TradingView cung cấp hoặc xác nhận. Đọc thêm tại Điều khoản Sử dụng.
Bài đăng liên quan
Thông báo miễn trừ trách nhiệm
Thông tin và các ấn phẩm này không nhằm mục đích, và không cấu thành, lời khuyên hoặc khuyến nghị về tài chính, đầu tư, giao dịch hay các loại khác do TradingView cung cấp hoặc xác nhận. Đọc thêm tại Điều khoản Sử dụng.