
Elliott Wave Count Suggests Wave (v) Breakout Building
Price: ₹569.55 on 14th July 2026 | Timeframe: Weekly
Structure Overview
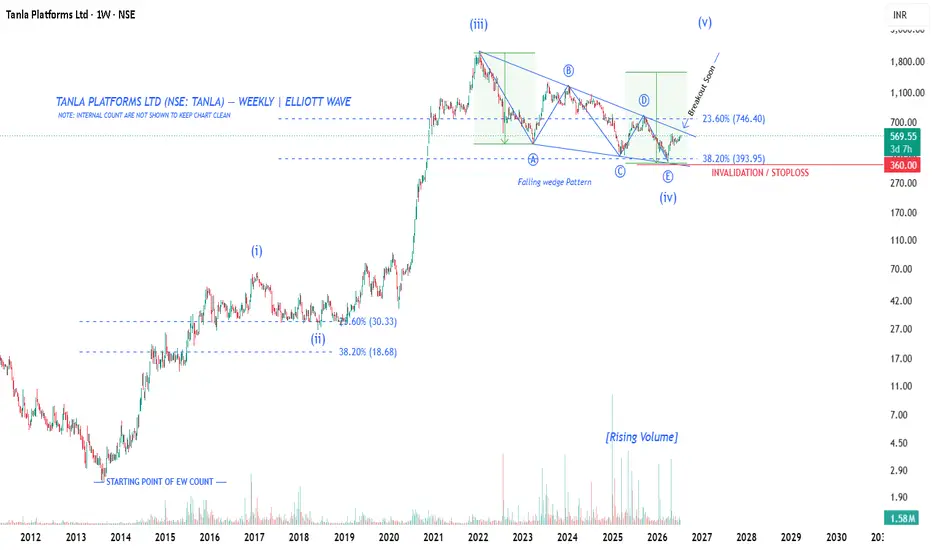
Tanla's long-term move from the 2020 lows appears to be unfolding as a five-wave impulse:
Wave (i): Initial rally off the base, retraced to the 38.2%–23.6% zone (₹18.68–₹30.33) before continuation.
Wave (iii): The dominant extended wave, driving price sharply from the ~₹100 zone to the swing high near ₹1,800–1,900.
Wave (iv): Currently unfolding as a complex corrective structure — labeled A-B-C-D-E — taking the shape of a contracting/falling wedge (triangle) pattern, a classic wave (iv) formation (triangles often appear in the 4th wave position per Elliott Wave theory).
Wave (v): Anticipated next leg higher, projected toward new highs above the wave (iii) peak.
Very Important Invalidation: A decisive weekly close below the level (₹360.0) as stop los / wedge lower boundary would put the bullish wave count at risk and suggest a deeper corrective structure instead.
Watch For
Volume expansion on the breakout candle
Retest of the wedge trendline as new support post-breakout
This is a technical/wave-count perspective for educational discussion, not financial advice. Elliott Wave counts are subjective and should be confirmed with additional confluence (volume, momentum, broader market context) before acting.
Price: ₹569.55 on 14th July 2026 | Timeframe: Weekly
Structure Overview
Tanla's long-term move from the 2020 lows appears to be unfolding as a five-wave impulse:
Wave (i): Initial rally off the base, retraced to the 38.2%–23.6% zone (₹18.68–₹30.33) before continuation.
Wave (iii): The dominant extended wave, driving price sharply from the ~₹100 zone to the swing high near ₹1,800–1,900.
Wave (iv): Currently unfolding as a complex corrective structure — labeled A-B-C-D-E — taking the shape of a contracting/falling wedge (triangle) pattern, a classic wave (iv) formation (triangles often appear in the 4th wave position per Elliott Wave theory).
Wave (v): Anticipated next leg higher, projected toward new highs above the wave (iii) peak.
Very Important Invalidation: A decisive weekly close below the level (₹360.0) as stop los / wedge lower boundary would put the bullish wave count at risk and suggest a deeper corrective structure instead.
Watch For
Volume expansion on the breakout candle
Retest of the wedge trendline as new support post-breakout
This is a technical/wave-count perspective for educational discussion, not financial advice. Elliott Wave counts are subjective and should be confirmed with additional confluence (volume, momentum, broader market context) before acting.

Thông báo miễn trừ trách nhiệm
Thông tin và các ấn phẩm này không nhằm mục đích, và không cấu thành, lời khuyên hoặc khuyến nghị về tài chính, đầu tư, giao dịch hay các loại khác do TradingView cung cấp hoặc xác nhận. Đọc thêm tại Điều khoản Sử dụng.
Thông báo miễn trừ trách nhiệm
Thông tin và các ấn phẩm này không nhằm mục đích, và không cấu thành, lời khuyên hoặc khuyến nghị về tài chính, đầu tư, giao dịch hay các loại khác do TradingView cung cấp hoặc xác nhận. Đọc thêm tại Điều khoản Sử dụng.