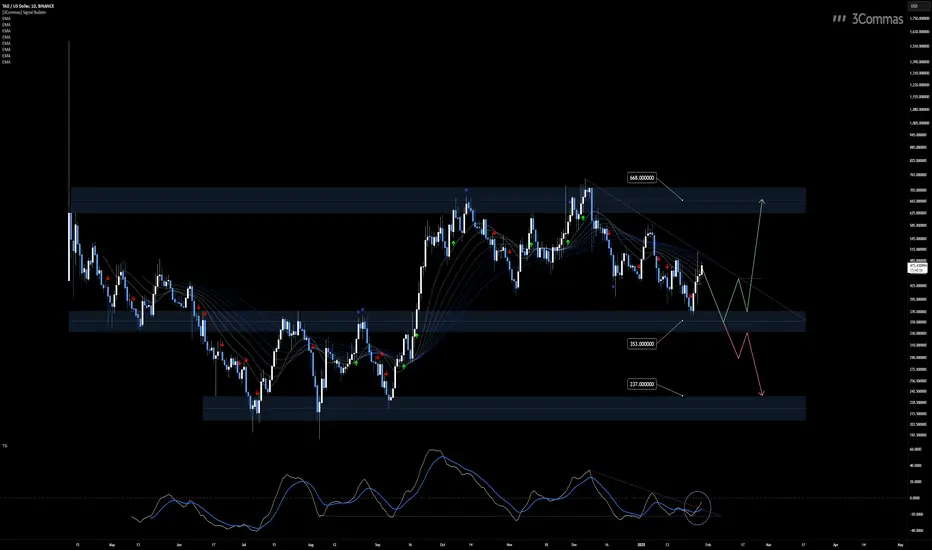
 TAOUSD recently rebounded from the $353 level, a historically significant reaction zone. This level has acted as a pivot for price action, and the recent rebound signals a potential shift in momentum. A breakout above the descending trendline, combined with a candle close beyond the previous swing high, would provide stronger confirmation of a structural change. If this occurs, the next target would likely be the prior highs near $668, representing a significant upside potential.
On the other hand, if the $353 support level fails to hold, the price could decline toward $237. This level has previously demonstrated strong accumulation characteristics, serving as a reliable area for reversals and potential entry points.
The TSI indicator supports the bullish outlook, having broken above its descending trendline and formed a bullish crossover. Although the TSI is still below the zero line, crossing above this threshold would provide additional confirmation of upward momentum. Furthermore, historical data shows that the price tends to rebound when the TSI reaches the -22 level, aligning with the current technical setup.
👨🏻💻💭 What is your take on this TAOUSD analysis? Do you anticipate a bullish breakout, or are you preparing for a dip? Share your insights!
__
The information and publications within the 3Commas TradingView account are not meant to be and do not constitute financial, investment, trading, or other types of advice or recommendations supplied or endorsed by 3Commas and any of the parties acting on behalf of 3Commas, including its employees, contractors, ambassadors, etc.

📈 Stop guessing your settings — backtest & optimize with QuantPilot
🎁 Free to start
🎁 Free to start
Thông báo miễn trừ trách nhiệm
Thông tin và các ấn phẩm này không nhằm mục đích, và không cấu thành, lời khuyên hoặc khuyến nghị về tài chính, đầu tư, giao dịch hay các loại khác do TradingView cung cấp hoặc xác nhận. Đọc thêm tại Điều khoản Sử dụng.
📈 Stop guessing your settings — backtest & optimize with QuantPilot
🎁 Free to start
🎁 Free to start
Thông báo miễn trừ trách nhiệm
Thông tin và các ấn phẩm này không nhằm mục đích, và không cấu thành, lời khuyên hoặc khuyến nghị về tài chính, đầu tư, giao dịch hay các loại khác do TradingView cung cấp hoặc xác nhận. Đọc thêm tại Điều khoản Sử dụng.