
Market Structure: A Bearish Trend Meets an Important Support Zone
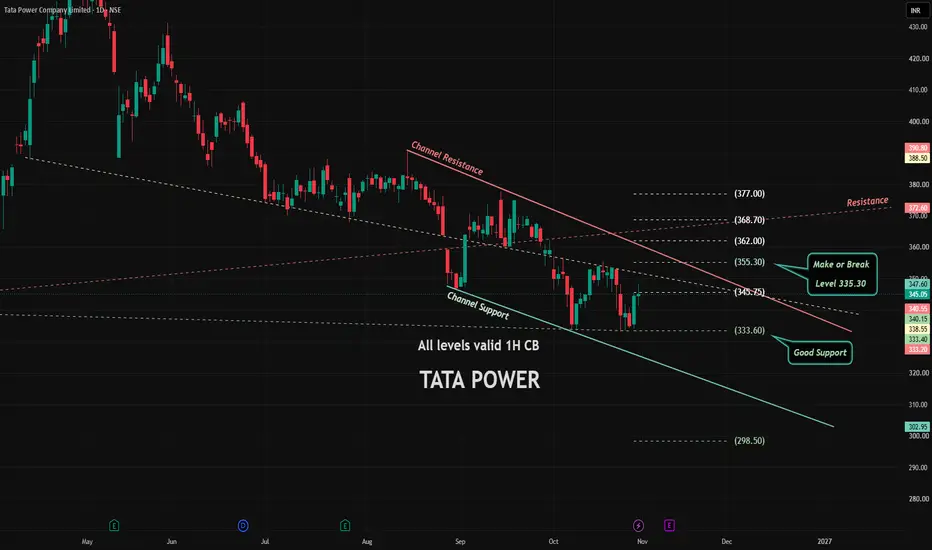
Tata Power continues to trade within a broader descending channel, characterised by a sequence of lower highs and lower lows. The stock's inability to sustain previous recovery attempts reflects persistent selling pressure and a lack of convincing bullish follow-through.
However, the recent price action around ₹333–335 deserves attention.
This region represents an important support cluster, where the stock has shown signs of buying interest. The question now is whether this demand will be sufficient to initiate a meaningful recovery or whether the prevailing bearish structure will remain dominant.
Key Technical Observations
1. Descending Channel Structure
The stock continues to respect a broader descending channel. The upper boundary acts as dynamic resistance, while the lower boundary represents the projected channel support.
Until the upper channel resistance is convincingly breached, the broader trend remains vulnerable to further selling pressure.
2. Critical Support: ₹333.60–335.30
This is the most important near-term decision zone.
The ability of buyers to defend this region could determine the next directional move. A sustained hold may provide a foundation for recovery, whereas a decisive breakdown below ₹333.60 would weaken the current support structure.
3. Immediate Recovery Hurdle: ₹355.30
The ₹355.30 level represents an important resistance threshold.
A sustained move above this level, preferably accompanied by expanding volume, would improve the short-term technical outlook.
4. Higher Resistance Levels
Beyond ₹355.30, the stock faces successive resistance levels at:
• ₹362.00
• ₹368.70
• ₹377.00
These levels could act as potential supply zones during any recovery attempt.
What Could Happen Next?
Bullish Scenario
A successful defence of ₹333.60–335.30, followed by a sustained recovery above ₹345.75 and ₹355.30, could open the way towards ₹362.00 and ₹368.70.
A decisive breakout above the descending channel resistance would provide stronger evidence of a potential structural reversal.
Bearish Scenario
Failure to sustain the current recovery, followed by a breakdown below ₹333.60, would indicate a weakening support structure.
Such a development could expose the stock to further downside, with ₹298.50 remaining an important deeper reference level on the chart.
The Bigger Picture
Tata Power is approaching a technically important inflection zone.
While the broader trend remains bearish, the stock is showing a potential support-led stabilisation attempt.
For now, the ₹333.60–335.30 region remains the key level to monitor, while ₹355.30 is the first meaningful hurdle for the bulls.
The next directional move will depend on how price behaves around these critical levels.
Patience and confirmation are more important than anticipating a breakout or breakdown.
Like.. Share.. Follow
Tata Power continues to trade within a broader descending channel, characterised by a sequence of lower highs and lower lows. The stock's inability to sustain previous recovery attempts reflects persistent selling pressure and a lack of convincing bullish follow-through.
However, the recent price action around ₹333–335 deserves attention.
This region represents an important support cluster, where the stock has shown signs of buying interest. The question now is whether this demand will be sufficient to initiate a meaningful recovery or whether the prevailing bearish structure will remain dominant.
Key Technical Observations
1. Descending Channel Structure
The stock continues to respect a broader descending channel. The upper boundary acts as dynamic resistance, while the lower boundary represents the projected channel support.
Until the upper channel resistance is convincingly breached, the broader trend remains vulnerable to further selling pressure.
2. Critical Support: ₹333.60–335.30
This is the most important near-term decision zone.
The ability of buyers to defend this region could determine the next directional move. A sustained hold may provide a foundation for recovery, whereas a decisive breakdown below ₹333.60 would weaken the current support structure.
3. Immediate Recovery Hurdle: ₹355.30
The ₹355.30 level represents an important resistance threshold.
A sustained move above this level, preferably accompanied by expanding volume, would improve the short-term technical outlook.
4. Higher Resistance Levels
Beyond ₹355.30, the stock faces successive resistance levels at:
• ₹362.00
• ₹368.70
• ₹377.00
These levels could act as potential supply zones during any recovery attempt.
What Could Happen Next?
Bullish Scenario
A successful defence of ₹333.60–335.30, followed by a sustained recovery above ₹345.75 and ₹355.30, could open the way towards ₹362.00 and ₹368.70.
A decisive breakout above the descending channel resistance would provide stronger evidence of a potential structural reversal.
Bearish Scenario
Failure to sustain the current recovery, followed by a breakdown below ₹333.60, would indicate a weakening support structure.
Such a development could expose the stock to further downside, with ₹298.50 remaining an important deeper reference level on the chart.
The Bigger Picture
Tata Power is approaching a technically important inflection zone.
While the broader trend remains bearish, the stock is showing a potential support-led stabilisation attempt.
For now, the ₹333.60–335.30 region remains the key level to monitor, while ₹355.30 is the first meaningful hurdle for the bulls.
The next directional move will depend on how price behaves around these critical levels.
Patience and confirmation are more important than anticipating a breakout or breakdown.
Like.. Share.. Follow
Giao dịch đang hoạt động
#Tatapower channel breakout, above 369 more BULL power
Bài đăng liên quan
Thông báo miễn trừ trách nhiệm
Thông tin và các ấn phẩm này không nhằm mục đích, và không cấu thành, lời khuyên hoặc khuyến nghị về tài chính, đầu tư, giao dịch hay các loại khác do TradingView cung cấp hoặc xác nhận. Đọc thêm tại Điều khoản Sử dụng.
Bài đăng liên quan
Thông báo miễn trừ trách nhiệm
Thông tin và các ấn phẩm này không nhằm mục đích, và không cấu thành, lời khuyên hoặc khuyến nghị về tài chính, đầu tư, giao dịch hay các loại khác do TradingView cung cấp hoặc xác nhận. Đọc thêm tại Điều khoản Sử dụng.