
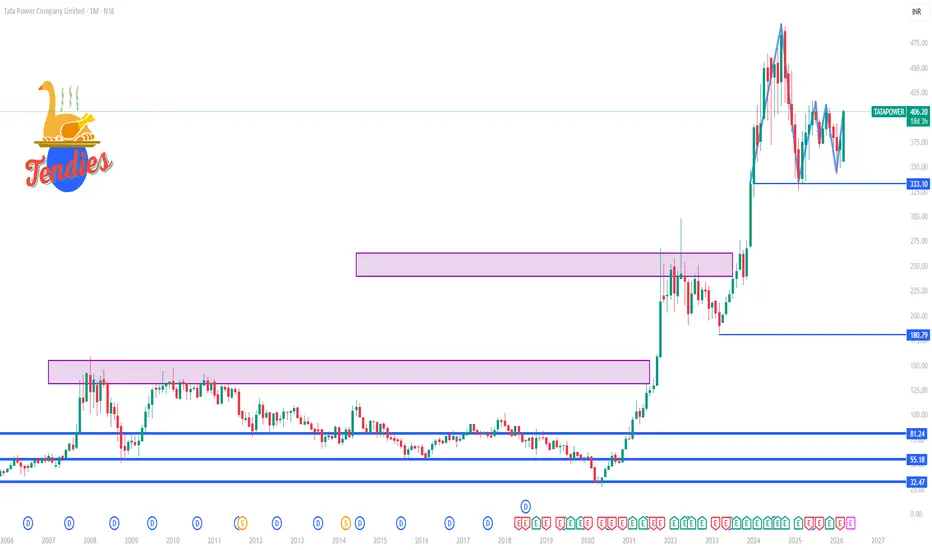
📌 Current Market Context
The stock is trading around ₹404 – ₹405 on NSE as of latest session.
📊 Monthly Technical Levels (1‑Month Pivot Points)
🔼 Resistance Levels (Upside Targets)
R1: ~₹392.50
R2: ~₹407.45
R3: ~₹429.50
(These are major monthly resistance zones where price may face selling pressure)
🟡 Pivot / Equilibrium Zone
Monthly Pivot Point: ~₹370.45
(Above this → bullish structure; below → bearish or consolidation)
🔽 Support Levels (Downside Zones)
S1: ~₹355.50
S2: ~₹333.45
S3: ~₹318.50
(Key support zones where buyers historically step in on dips)
📈 What This Means (Monthly Timeframe View)
📊 Bullish Scenario
If price sustains above ₹407–₹429 area, the trend can extend toward new structural highs within the 1‑month context.
RSI & long‑term averages are showing mild strength.
🤝 Neutral / Consolidation Zone
Price action between ₹370 – ₹407 indicates range‑bound behavior, suggesting traders wait for a clear breakout before bullish confirmation.
Pivot at ₹370.45 is key mid‑market reference.
📉 Bearish / Correction Zone
A clear breakdown below ₹355.50 → ₹333.45 could signal deeper correction on the monthly scale and shift momentum lower.
The stock is trading around ₹404 – ₹405 on NSE as of latest session.
📊 Monthly Technical Levels (1‑Month Pivot Points)
🔼 Resistance Levels (Upside Targets)
R1: ~₹392.50
R2: ~₹407.45
R3: ~₹429.50
(These are major monthly resistance zones where price may face selling pressure)
🟡 Pivot / Equilibrium Zone
Monthly Pivot Point: ~₹370.45
(Above this → bullish structure; below → bearish or consolidation)
🔽 Support Levels (Downside Zones)
S1: ~₹355.50
S2: ~₹333.45
S3: ~₹318.50
(Key support zones where buyers historically step in on dips)
📈 What This Means (Monthly Timeframe View)
📊 Bullish Scenario
If price sustains above ₹407–₹429 area, the trend can extend toward new structural highs within the 1‑month context.
RSI & long‑term averages are showing mild strength.
🤝 Neutral / Consolidation Zone
Price action between ₹370 – ₹407 indicates range‑bound behavior, suggesting traders wait for a clear breakout before bullish confirmation.
Pivot at ₹370.45 is key mid‑market reference.
📉 Bearish / Correction Zone
A clear breakdown below ₹355.50 → ₹333.45 could signal deeper correction on the monthly scale and shift momentum lower.

Contact Knowledgehub for a detailed consultation: Dm on WhatsApp: [wa.link/a2o0kz]-
Phone No: [+91 93102 26243]-
Email: [tradingviewknowledgehub@gmail.com]---
-- Let’s achieve success together!
Phone No: [+91 93102 26243]-
Email: [tradingviewknowledgehub@gmail.com]---
-- Let’s achieve success together!
Bài đăng liên quan
Thông báo miễn trừ trách nhiệm
Thông tin và các ấn phẩm này không nhằm mục đích, và không cấu thành, lời khuyên hoặc khuyến nghị về tài chính, đầu tư, giao dịch hay các loại khác do TradingView cung cấp hoặc xác nhận. Đọc thêm tại Điều khoản Sử dụng.
Contact Knowledgehub for a detailed consultation: Dm on WhatsApp: [wa.link/a2o0kz]-
Phone No: [+91 93102 26243]-
Email: [tradingviewknowledgehub@gmail.com]---
-- Let’s achieve success together!
Phone No: [+91 93102 26243]-
Email: [tradingviewknowledgehub@gmail.com]---
-- Let’s achieve success together!
Bài đăng liên quan
Thông báo miễn trừ trách nhiệm
Thông tin và các ấn phẩm này không nhằm mục đích, và không cấu thành, lời khuyên hoặc khuyến nghị về tài chính, đầu tư, giao dịch hay các loại khác do TradingView cung cấp hoặc xác nhận. Đọc thêm tại Điều khoản Sử dụng.