
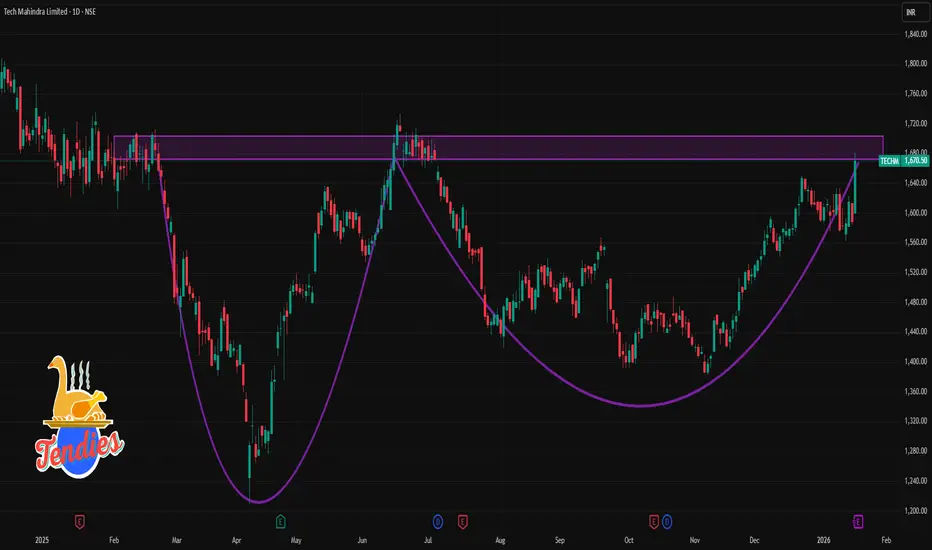
📍 Latest Price Range (Today on NSE):
• Low ~ ₹1,600 and High ~ ₹1,681 (intraday range) from current data today.
🔁 Key Levels for 1‑Day Timeframe
Immediate Resistance Levels
These are zones where price may face selling pressure if it rises:
R1: ~ ₹1,700 – ₹1,702
R2: ~ ₹1,731 – ₹1,732
R3: ~ ₹1,781 – ₹1,782
Pivot
Daily Pivot Point: ~ ₹1,659 – ₹1,660 (indicative mid‑point of the current range)
Support Levels
These are zones where price may find demand on declines:
S1: ~ ₹1,620 – ₹1,621
S2: ~ ₹1,569 – ₹1,570
S3: ~ ₹1,539 – ₹1,540
📊 Technical Indicators Snapshot
(Not direct price levels, but useful context on daily price behavior)
Moving averages (20/50/100/200) are in the ~₹1,530‑₹1,590 range, offering dynamic support/resistance clusters.
RSI & momentum oscillators on some indicators show mixed to neutral momentum on daily charts — suggesting a range‑bound bias unless there’s a breakout.
📌 How Traders Use These Levels
Bullish scenario: A sustained close above ₹1,700 could open upside to ₹1,730/₹1,780.
Bearish scenario: Breakdown below ₹1,620 and ₹1,570 may head toward ₹1,540 support.
Pivot area (~₹1,660) acts as a short‑term balance zone: above it favors buyers, below it favors sellers.

Contact Knowledgehub for a detailed consultation: Dm on WhatsApp: [wa.link/a2o0kz]-
Phone No: [+91 93102 26243]-
Email: [tradingviewknowledgehub@gmail.com]---
-- Let’s achieve success together!
Phone No: [+91 93102 26243]-
Email: [tradingviewknowledgehub@gmail.com]---
-- Let’s achieve success together!
Bài đăng liên quan
Thông báo miễn trừ trách nhiệm
Thông tin và các ấn phẩm này không nhằm mục đích, và không cấu thành, lời khuyên hoặc khuyến nghị về tài chính, đầu tư, giao dịch hay các loại khác do TradingView cung cấp hoặc xác nhận. Đọc thêm tại Điều khoản Sử dụng.