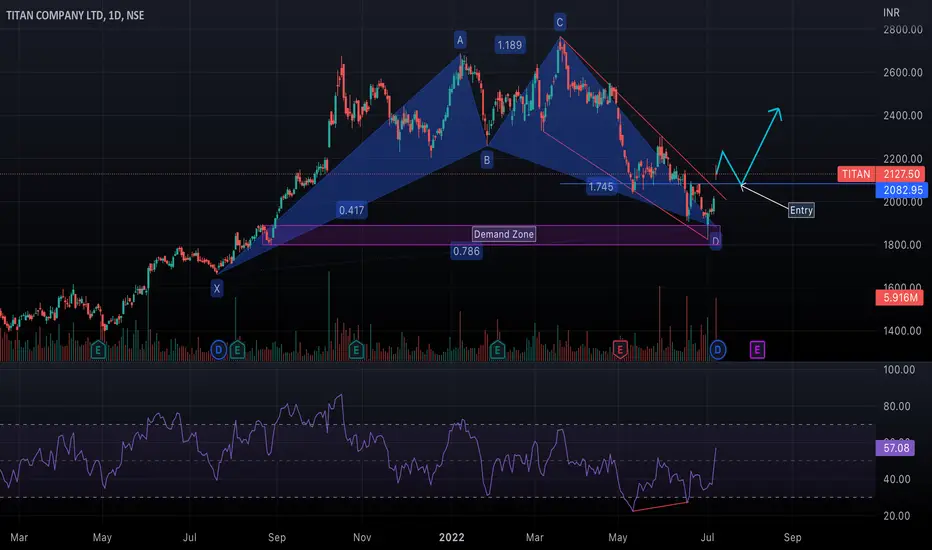
Let's understand multi timeframe analysis for  TITAN.
Weekly TF -
TITAN has been trading in a falling wedge pattern (LH-LL) and has recently re-tested a major demand zone. A bullish engulfing candlestick has been formed. There's an additional confluence of Harmonic Cypher PRZ around 1880.

Daily TF -
Bullish RSI divergence has been seen on daily TF. Price gaped up and did a breakout from a falling wedge structure. Short term bullish entry can be taken if price retraces back to 2080 level which was acting as a resistance earlier.

TITAN.Weekly TF -
TITAN has been trading in a falling wedge pattern (LH-LL) and has recently re-tested a major demand zone. A bullish engulfing candlestick has been formed. There's an additional confluence of Harmonic Cypher PRZ around 1880.Daily TF -
Bullish RSI divergence has been seen on daily TF. Price gaped up and did a breakout from a falling wedge structure. Short term bullish entry can be taken if price retraces back to 2080 level which was acting as a resistance earlier.
Ghi chú
Price reversed as per the analysis and moved higher.
Thông báo miễn trừ trách nhiệm
Thông tin và các ấn phẩm này không nhằm mục đích, và không cấu thành, lời khuyên hoặc khuyến nghị về tài chính, đầu tư, giao dịch hay các loại khác do TradingView cung cấp hoặc xác nhận. Đọc thêm tại Điều khoản Sử dụng.
Thông báo miễn trừ trách nhiệm
Thông tin và các ấn phẩm này không nhằm mục đích, và không cấu thành, lời khuyên hoặc khuyến nghị về tài chính, đầu tư, giao dịch hay các loại khác do TradingView cung cấp hoặc xác nhận. Đọc thêm tại Điều khoản Sử dụng.