
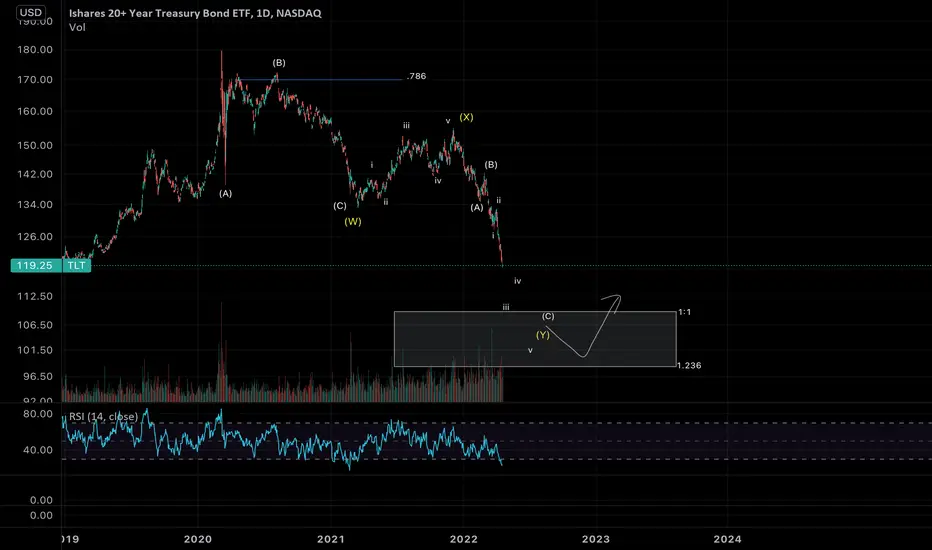
Applying simple Elliot wave analysis, I see an ABC pattern with a failed 5 wave move up marked as X wave, the first ABC is then labeled as W and projected 1:1 ratio from top of (X) brings us down to the box area, where TLT is most likely to find support (1:1 & 1.236 Fib ratio).
I see the price dropping without retest of major resistances that it broke through, and a price fall in a straight line is unsustainable, its like stretching a rubber band and eventually price will rebound violently.
I would give it a 60% probability of reversal at that point and daily bullish divergence should be a very strong sign of imminent reversal.
Cheers
I see the price dropping without retest of major resistances that it broke through, and a price fall in a straight line is unsustainable, its like stretching a rubber band and eventually price will rebound violently.
I would give it a 60% probability of reversal at that point and daily bullish divergence should be a very strong sign of imminent reversal.
Cheers

Thông báo miễn trừ trách nhiệm
Thông tin và các ấn phẩm này không nhằm mục đích, và không cấu thành, lời khuyên hoặc khuyến nghị về tài chính, đầu tư, giao dịch hay các loại khác do TradingView cung cấp hoặc xác nhận. Đọc thêm tại Điều khoản Sử dụng.
Thông báo miễn trừ trách nhiệm
Thông tin và các ấn phẩm này không nhằm mục đích, và không cấu thành, lời khuyên hoặc khuyến nghị về tài chính, đầu tư, giao dịch hay các loại khác do TradingView cung cấp hoặc xác nhận. Đọc thêm tại Điều khoản Sử dụng.